Kubernetes Architecture Explained: Core Components, Planes, and Best Practices
Kubernetes architecture explained: learn control plane vs. worker nodes, core components, workloads, networking, storage, and best practices. A step-by-step guide for deploying, scaling, and securing containerized applications at scale.
Have you ever wondered how some of the world’s largest applications, such as Netflix, Spotify, Uber, Google, and YouTube, handle millions of requests, scale instantly, and self-heal when components fail?
A decade ago, such capabilities would have seemed almost impossible. However, the need to manage the chaos of distributed systems while maintaining the agility that modern businesses demand led to the discovery of Kubernetes.
In this article, we will discuss Kubernetes architecture, its components, and best practices to help you gain in-depth knowledge to resolve issues such as network misconfigurations and persistent storage problems.
| Kubernetes Architecture at a Glance | ||
|---|---|---|
| Component / Concept | Role / Responsibility | Key Considerations |
| Control Plane | Brain of Kubernetes; manages scheduling, scaling, cluster state | Ensure high availability; secure etcd; API server is single source of truth |
| Worker Nodes (Data Plane) | Run application Pods and workloads | Scale independently; monitor kubelet and kube-proxy health |
| Cluster | Combination of control plane + worker nodes | Provides automation, resiliency, and scalability |
| Core Components | API Server, Scheduler, Controller Manager, etcd, Cloud Controller Manager | Secure API access; backup etcd; fine-tune scheduling |
| Node Components | Kubelet, Kube-proxy, Container Runtime | Critical for Pod execution and networking |
| Workloads | Pods, Deployments, StatefulSets, DaemonSets, Jobs, Services | Choose workload type based on persistence, scaling, and lifecycle needs |
| Networking (CNI) | Networking (CNI) Enables Pod-to-Pod and Pod-to-service communication | Use Calico for policies, Flannel for simplicity |
| Storage (CSI) | Provides persistent storage across workloads | Choose CSI driver based on workload (databases vs. stateless apps) |
| Extensibility | CRDs, Operators, Admission Controllers, Plugins | Extend Kubernetes to fit custom needs |
| Deployment Model | Managed (EKS, GKE, AKS) vs. Self-Managed (kubeadm, K3s) | Tradeoff between control and operational overhead |
| Cluster Setup | Single vs. Multi-cluster | Single = simplicity; Multi = geo-distribution, compliance, high availability |
| Add-ons | Service Mesh, Monitoring, Logging, Security Tools | Adds complexity; adopt progressively |
What is Kubernetes Architecture?
Kubernetes is an open-source container orchestration system designed to automate the deployment, scaling, and management of containerized applications.
At its core, Kubernetes follows a cluster-based architecture. So when I set up Kubernetes, I’m really creating a cluster, which is a group of machines (these can be either physical or virtual) that are orchestrated together to run containers efficiently.
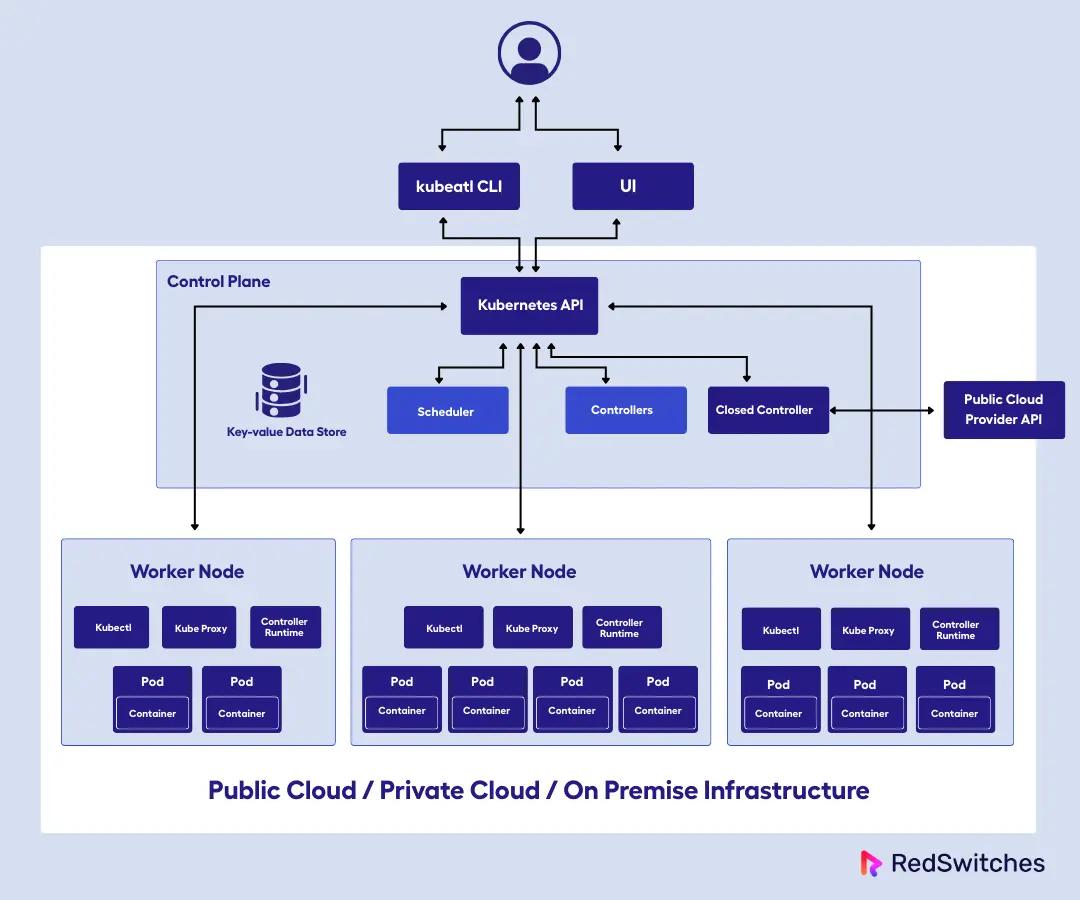
As we said, Kubernetes organizes infrastructure into clusters. It is composed of two main layers:
- Control plane (the brain of the system)
- Worker nodes (where application workloads run)
Kubernetes Control Plane: Core Components and Functions
When I say the control plane is the brain of the system, I mean this is where all the decision-making happens. When you troubleshoot issues, you typically start here because the control plane is responsible for:
- Making scheduling decisions about where pods should run
- Storing the entire cluster state in etcd
- Exposing the API that both kubectl and other components use
- Managing cluster-wide policies and configurations
- Scheduling, scaling, and maintaining the desired state of the cluster.
Kubernetes Worker Nodes (Data Plane): Components and Role
Worker plane or Nodes are the machines (virtual or physical) that actually run the application containers. Each node in the cluster (there are often many) runs the containers as instructed by the control plane.
Since the control plane and worker plane are separate, it is quite easy to scale worker nodes independently based on workload demands, while keeping the control plane stable and highly available.
If you ask me what truly sets Kubernetes apart, I would say it is its modular design. Kubernetes’s extensibility is unmatched. The system is built around well-defined APIs and interfaces, which means I can:
- Swap out components
- Add custom resources
- Integrate external systems
- Customize networking
So in total, since Kubernetes is highly modular and extensible, you can add custom resources, controllers, and plugins to adapt the platform to our specific needs, whether that’s integrating with a particular cloud provider, adding advanced networking, or automating complex application lifecycles.
To better understand this, let us take an example.
Think of Kubernetes like a water theme park, which is the Cluster. The main office or central control center is the Control Plane. It plans and oversees everything, including opening and closing rides, managing staff schedules, and ensuring the park runs smoothly.
The rides and attractions are the Worker Nodes, where guests (applications/containers) experience the fun. The ride operators and staff are like the kubelet. They ensure that each ride operates properly and that guests are safe.
So, just like managing a busy theme park involves coordinating many moving parts like rides, staff, and guests, Kubernetes is about managing containers, resources, and services effectively to deliver smooth, scalable application deployments.
What is a Kubernetes Cluster?
A Kubernetes cluster is the fundamental unit of deployment and management in Kubernetes. It consists of:
- Control Plane: The set of components that manage the overall state and configuration of the cluster.
- Multiple Worker Nodes: The machines that actually run the containerized workloads.
The primary purpose of a Kubernetes cluster is to manage containerized workloads and services in a way that is automated, resilient, and scalable. The cluster enables us to deploy applications across multiple nodes, ensuring high availability and efficient resource utilization.
One of the most powerful aspects of Kubernetes clusters is their distributed and horizontally scalable nature. I can start with a three-node cluster for development, and as my applications demand more resources, I can add hundreds or thousands of nodes.
In addition, a Kubernetes cluster can automatically redistribute workloads when nodes fail, scale applications based on traffic patterns, and manage rolling updates across distributed services without downtime.
Kubernetes Control Plane Components
The control plane is what I call the brain of Kubernetes. It’s responsible for all global decisions about the cluster. This includes what runs where, how resources are allocated, and how the system responds to changes or failures.
So, every time you interact with a cluster through kubectl or deploy a new application, you are communicating with the control plane components.
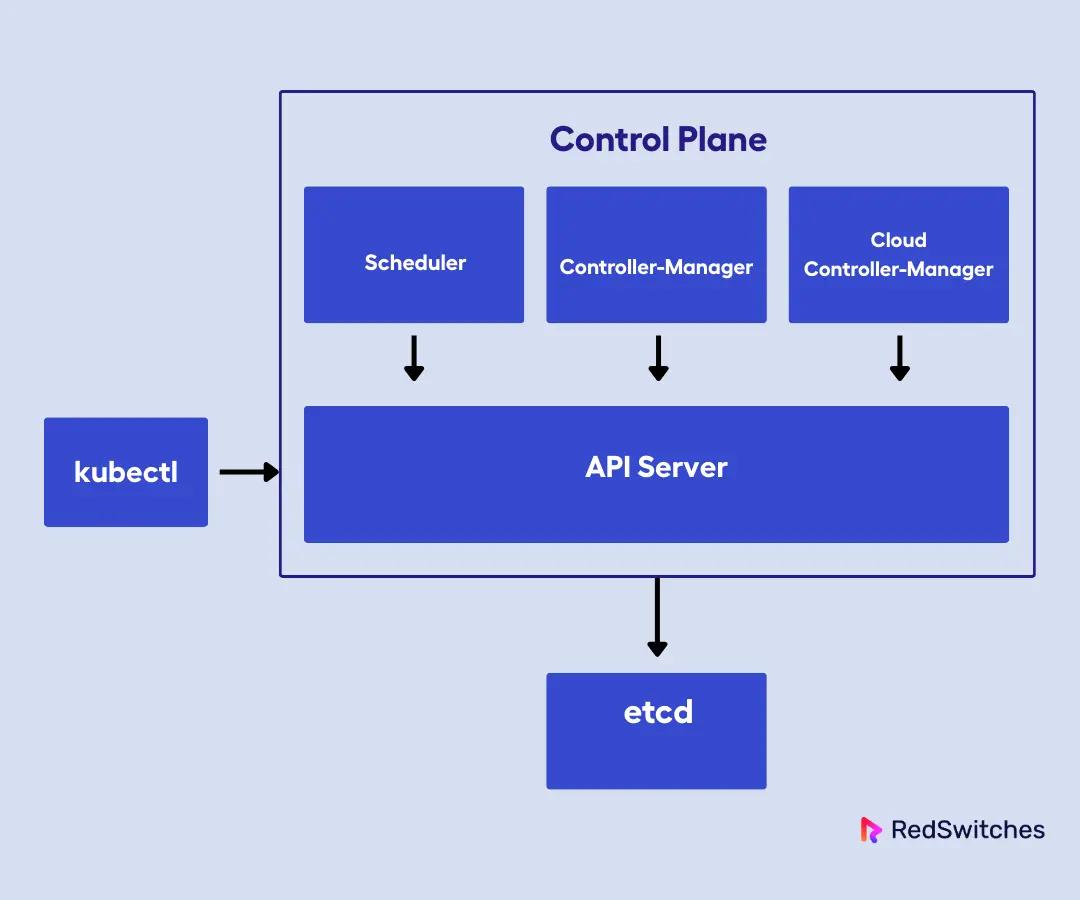
Let us now look at the control plane components:
API Server (kube-apiserver)
The API server is the front end of the Kubernetes control plane. Every command, whether it comes from the CLI, a GUI, or an automated process, goes through the API server.
It handles all REST operations, validates requests, handles authentication and authorization, and serves as the only component that directly communicates with the underlying data store (etcd).
Controller Manager (kube-controller-manager)
The controller manager runs a set of controllers, each responsible for maintaining a specific aspect of the cluster’s state. For example, the node controller monitors node health, the job controller manages batch jobs, and so on.
You can think of controllers as the workers that continuously watch the cluster state and reconcile the desired versus the actual state. This is what enables self-healing and automation in Kubernetes.
For instance, when I create a Deployment requesting three replicas of an application, the Deployment controller notices this desire and works to ensure exactly three pods are always running. If a pod crashes, the controller detects the deviation from the desired state and creates a new pod to replace it.
Scheduler (kube-scheduler)
The scheduler is responsible for assigning newly created pods to available nodes. It evaluates resource requirements, affinity/anti-affinity rules, and other constraints to make intelligent placement decisions.
When I submit a pod for scheduling, the scheduler evaluates every node in the cluster against the pod’s requirements.
The scheduler is critical for ensuring that workloads are distributed efficiently and that no single node is overloaded.
etcd
etcd is a distributed key-value store that holds the entire configuration and state of the cluster. In other words, every object I create in Kubernetes, which includes pods, services, secrets, and configurations, lives in etcd.
If etcd is unavailable, the control plane can’t function, which is why we always run etcd in a highly available configuration.
I treat etcd with extreme care in production environments. It’s the most critical component for cluster data persistence, and I always run it with proper backup strategies and high availability configurations. Losing etcd means losing your cluster state, which is catastrophic.
Cloud Controller Manager
The cloud controller manager separates the cloud-specific logic from the core Kubernetes components. It manages things like cloud load balancers, persistent volumes, and node lifecycle events that are specific to a particular cloud provider.
For instance, when I deploy services of type LoadBalancer, the cloud controller manager interfaces with AWS, GCP, or Azure APIs to provision actual load balancers.
This separation, where Kubernetes splits cloud-specific functionality away from its core logic, allows Kubernetes components to remain cloud-agnostic, while the cloud controller manager handles the specific integrations.
Kubernetes Node Components: Kubelet, Kube-Proxy, Container Runtime
Worker nodes are where the real work happens. They execute the scheduled workloads and run the essential services that keep containers healthy and connected.
Each worker node runs the same set of core components, which creates a uniform execution environment across the cluster. This consistency means you can schedule workloads on any node, knowing that the necessary services are available.
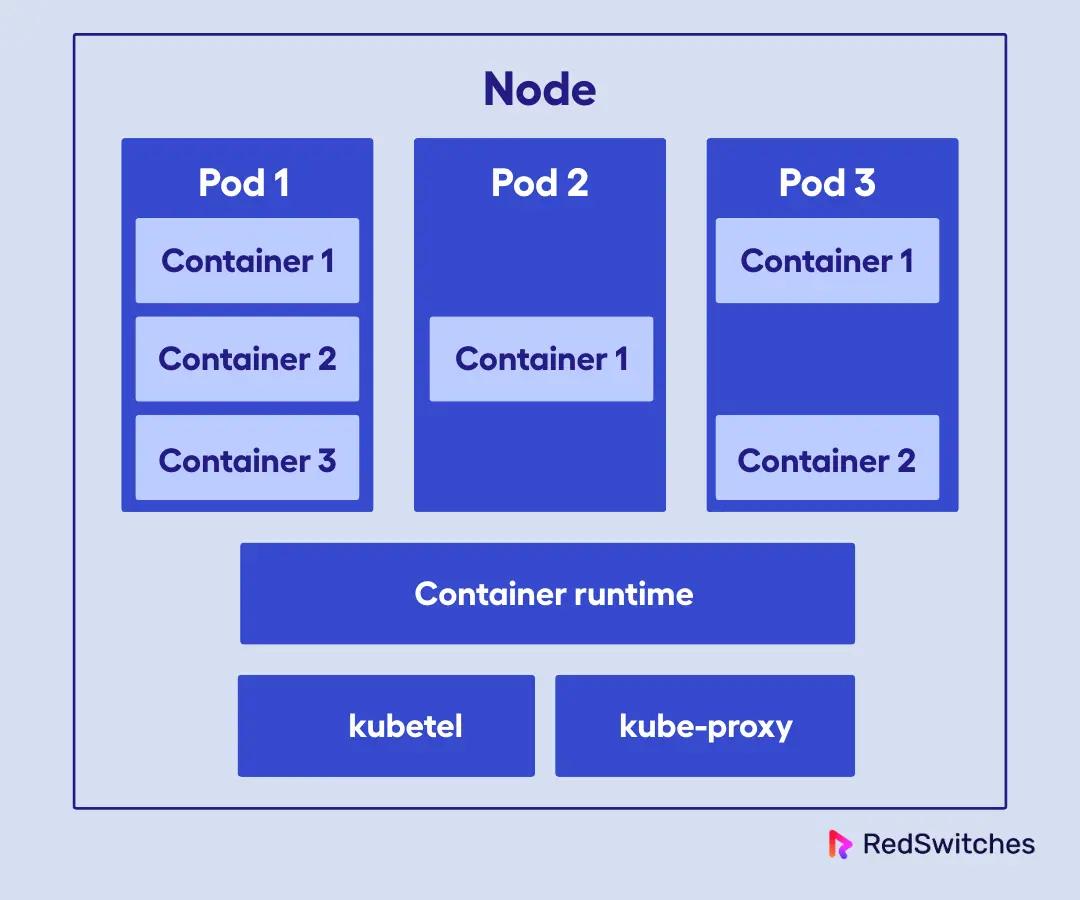
Each node runs several key components. They are:
kubelet
The kubelet is the primary node agent that ensures containers are running in a Pod according to the specifications provided by the control plane. It communicates with the API server to receive instructions and reports back on the status of the node and its pods. If a container crashes, the kubelet will restart it automatically.
In my experience, the kubelet is the most critical component on worker nodes. It pulls container images, starts containers, monitors their health, and reports status back to the control plane. When troubleshooting node issues, I typically start by examining kubelet logs.
Kube-Proxy
Kube-proxy is responsible for network routing and forwarding. It manages the network rules that allow communication between pods and services, both within the cluster and from external sources.
Every time we create a service in Kubernetes, kube-proxy ensures traffic can reach the appropriate pods.
We have worked with different kube-proxy modes (iptables, IPVS, userspace) depending on performance and feature requirements. The proxy maintains network rules on each node that enable load balancing and service discovery across the cluster.
In my deployment experiences, I learned that understanding kube-proxy behavior is necessary for debugging network connectivity issues and optimizing service performance.
Container Runtime
The container runtime is the software that actually runs the containers. Kubernetes supports several runtimes, including containerd, CRI-O, and (historically) Docker, though Docker is now deprecated as a runtime in Kubernetes. The runtime pulls container images, creates containers from those images, and manages their lifecycle.
The Container Runtime Interface (CRI) allows Kubernetes to work with different container runtimes, which allows you to choose the one that best fits your needs
Kubernetes Workloads Explained: Pods, Deployments, Services, Jobs, DaemonSets, StatefulSets
When I talk about Kubernetes workloads, I’m referring to the various abstractions that define how applications run and scale in Kubernetes. Workloads are the building blocks that let us deploy, manage, and automate containerized applications efficiently.
In my experience, I would say understanding workloads is essential because they determine how your applications behave under different conditions: how they scale, how they handle failures, and how they integrate with the broader cluster ecosystem.
Pod
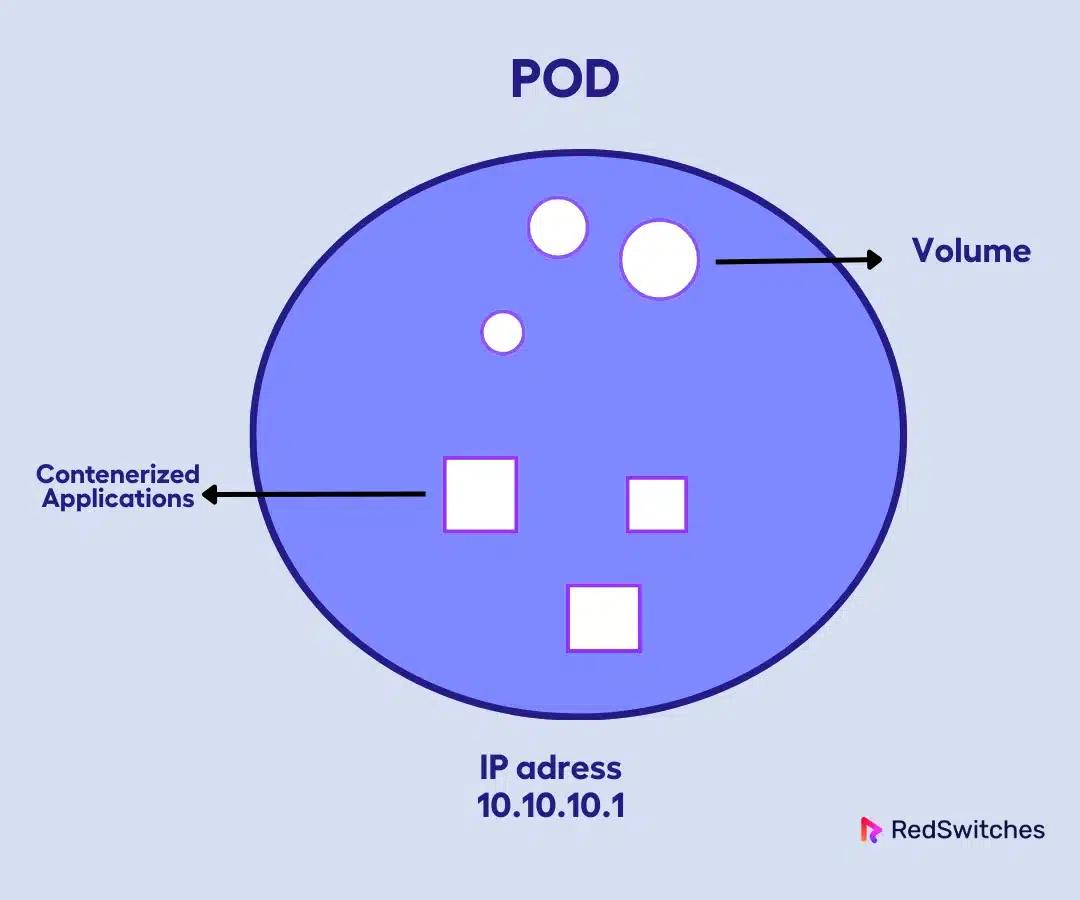
The Pod is the smallest deployable unit in Kubernetes. Think of it as the atomic unit of scheduling and deployment. A Pod can contain a single container or multiple tightly coupled containers that share storage, network, and lifecycle.
The containers in a Pod share localhost networking, which means they can communicate directly without complex service discovery.
Deployment
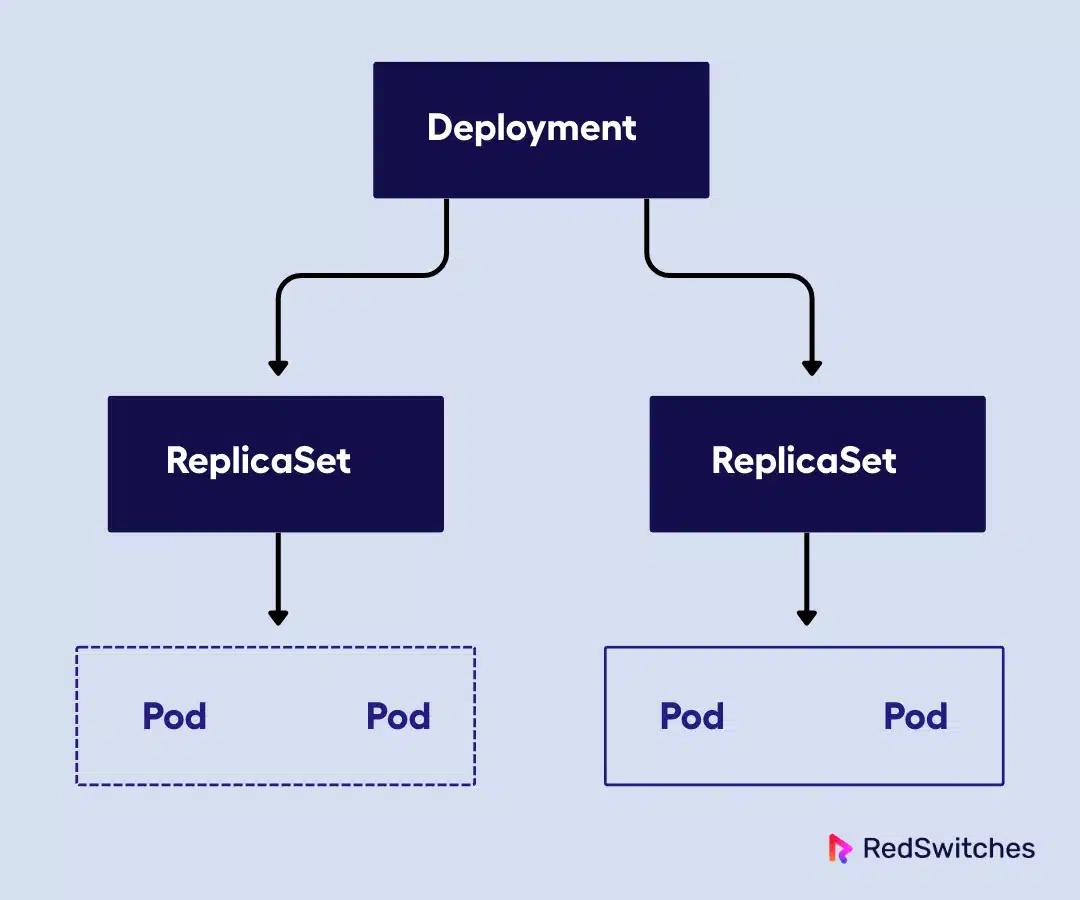
A Deployment is a declarative way to manage a set of Pod replicas. Instead of managing Pods individually, you can use Deployments to specify the desired number of replicas, and Kubernetes handles creating, updating, or rolling back Pods as needed.
For instance, when I create a Deployment specifying three replicas, Kubernetes ensures three Pods are always running, replacing failed ones automatically. Now the real power is during updates. You can change the container image, and Kubernetes will perform a rolling update, gradually replacing old Pods with new ones without downtime.
Service
A Service acts as a stable way to access a group of Pods, even as those Pods are created or destroyed over time. Since Pods are short-lived and have dynamic IPs, Services solve the challenge of reliable communication between components in your application.
There are different types of Services:
- ClusterIP: Internal-only access within the cluster.
- NodePort: Exposes the Service on a static port on each node.
- LoadBalancer: Integrates with cloud providers to provision external load balancers.
This abstraction is crucial for reliable communication between components.
Job
Jobs run a Pod to completion and are useful for batch tasks like data processing, backups, or one-time administrative tasks. Unlike other workloads that maintain long-running processes, Jobs are designed to complete successfully and then terminate; that is, once the Job completes, its associated Pods terminate.
I frequently use Jobs for database migrations, batch data processing, and scheduled maintenance tasks. Jobs can be configured to run multiple Pods in parallel or sequentially, and they handle Pod failures by restarting failed Pods until the job completes successfully.
DaemonSet
A DaemonSet ensures that a specific Pod runs on all or some nodes in the cluster. This is ideal for running cluster-wide services like logging agents, monitoring daemons, or network proxies that need to be present on every node.
I use DaemonSets extensively for infrastructure services like log collectors, monitoring agents like Node Exporter, and network plugins. The beauty of DaemonSets is their automatic scaling with cluster growth; I don’t need to manually manage these infrastructure services as my cluster expands.
StatefulSet
For applications that require stable network IDs and persistent storage, like databases or distributed systems, I use a StatefulSet. It manages the deployment and scaling of Pods with unique identities and stable storage, ensuring ordered, graceful deployment and scaling.
StatefulSets also support ordered rolling updates and provide guarantees about Pod identity that stateful applications require for cluster formation and data consistency.
Kubernetes Operators
In my work, Kubernetes Operators are powerful custom controllers that extend Kubernetes APIs to automate the lifecycle of complex applications. Automating the lifecycle of complex applications includes tasks like database provisioning, backup scheduling, failover handling, and version upgrades. Instead of manual intervention, Operators continuously monitor application state and take corrective actions based on encoded best practices.
Operators are typically built using frameworks like controller-runtime or the Operator SDK, which simplify writing custom controllers that watch for changes and act accordingly. This approach turns Kubernetes into a platform that can manage not just containers but entire application ecosystems seamlessly.
Kubernetes Networking (CNI) and Storage (CSI) Explained
Kubernetes is designed to be highly extensible, especially in its networking and storage subsystems.
This extensibility is achieved through well-defined interfaces, primarily the Container Network Interface (CNI) for networking and the Container Storage Interface (CSI) for storage. Therefore, I can deploy CNI plugins like Calico or Flannel for networking based on performance, security, or feature requirements, while CSI plugins enable persistent storage integration with various storage systems.
Now talking about the CNI plugins, the two most popular CNI plugins I’ve worked with are Calico and Flannel:
- Calico is my go-to for production environments that require robust network policy enforcement and scalability. It uses BGP routing for efficient networking and supports multiple modes, including IP-in-IP, VXLAN, and direct routing.
- Flannel is a simpler solution, perfect for smaller clusters or development environments. It provides basic networking using an overlay network (typically VXLAN) and is very easy to set up
Now, talking about the CSI plugins, they are used for persistent storage. The CSI drivers run as pods in the cluster and handle volume provisioning, attachment, and mounting. This gives the flexibility, rapid innovation, and the ability to use the best storage solution for the workload.
Kubernetes Cluster DNS: CoreDNS vs. kube-dns
Almost every Kubernetes cluster includes an in-cluster DNS (CoreDNS or kube-dns) to provide internal name resolution. This makes it easy for Pods and other resources to discover and connect with each other by service names.
I rely on DNS to allow pods and services to communicate using predictable hostnames rather than ephemeral IP addresses.
The two important DNS that provide internal name resolution within the cluster are CoreDNS and kube-dns.
- CoreDNS: This is now the default DNS service in Kubernetes. It’s highly modular and extensible, letting us add plugins for custom DNS behavior, load balancing, health checks, and more. CoreDNS is lightweight and efficient, making it suitable for clusters of any size.
- kube-dns: The original DNS implementation, kube-dns, is still available but is less flexible and performant than CoreDNS. I only use kube-dns in legacy environments
Kubernetes Dashboard (Web UI): Features and Security Risks
The Kubernetes Dashboard is a web-based UI that I use for visual management of the cluster. It provides a graphical overview of nodes, pods, deployments, services, and more. I can monitor resource usage, view logs, manage deployments, and even troubleshoot issues directly from the dashboard.
However, the key important point I need to emphasize is the security considerations. I’ve seen many security incidents involving poorly secured dashboards, so proper authentication and authorization are non-negotiable.
I typically deploy the dashboard with:
- RBAC (Role-Based Access Control): I always configure RBAC to ensure users only have access to the resources they need. This minimizes the risk of accidental or malicious changes
- HTTPS: I enforce HTTPS for all dashboard access to protect sensitive data in transit.
- Authentication: I integrate with secure authentication providers (OAuth, OpenID Connect, or Kubernetes service accounts) and avoid exposing the dashboard to the public internet. Access is typically restricted to trusted networks or via kubectl proxy.
Kubernetes Cluster Logging: Fluentd, Logstash, Promtail
Centralized logging is essential for troubleshooting, auditing, and monitoring. In Kubernetes, I typically use one or more of the following integrations:
- Fluentd: Deployed as a DaemonSet, Fluentd collects logs from all nodes and forwards them to backends like Elasticsearch. It’s highly flexible and supports a wide range of input/output plugins
- Logstash: While not frequently run directly in Kubernetes, Logstash is powerful for complex log processing and is often used as part of the ELK stack (Elasticsearch, Logstash, Kibana)
- Promtail: Designed for use with Grafana Loki, Promtail is lightweight and integrates seamlessly with the Grafana ecosystem. It’s my preferred choice when using Loki for log aggregation
Some of the best practices I would suggest for log aggregation are:
- Deploy as DaemonSets: Ensures every node is covered.
- Label and Enrich Logs: Add Kubernetes metadata (namespace, pod, container) for better filtering and analysis.
- Centralize Storage: Use scalable backends (Elasticsearch, Loki) for long-term retention and searchability.
- Secure Log Transport: Encrypt logs in transit and restrict access to log storage systems.
Kubernetes Extensibility: CRDs, Admission Controllers, and Plugins
Kubernetes is not a monolithic system; it’s a platform designed for extensibility through Custom Resources (CRDs), admission controllers, and plugins. This is one of the reasons I love working with it. It allows me to tailor the cluster to my organization’s needs.
Custom Resources (CRDs), Admission Controllers, and Plugins
- Custom Resource Definitions (CRDs): CRDs let me define new resource types in the Kubernetes API. For example, I can create a custom resource for a database, a backup job, or any domain-specific object. This enables automation and self-service for complex workflows
- Admission Controllers: These are plugins that intercept API requests before they’re persisted. I use them to enforce policies (like requiring labels, restricting image registries, or mutating resources for compliance)
- Plugins: Kubernetes supports a wide range of plugins for networking, storage, authentication, and more, allowing me to extend its capabilities without modifying the core codebase.
Some of the powerful examples from my production deployments are:
- Istio (Service Mesh): I use Istio to manage microservices traffic, enforce security (mutual TLS), and gain deep observability into service-to-service communication. It leverages CRDs for configuration and integrates seamlessly with Kubernetes
- Open Policy Agent (OPA): OPA, often used with Gatekeeper, lets me define and enforce custom policies using a declarative language (Rego). It’s invaluable for governance and compliance
- cert-manager: This extension automates the issuance and renewal of TLS certificates, integrating with Let’s Encrypt and other CAs. It’s essential for securing ingress traffic and internal service communication.
Managed vs. Self-Managed Kubernetes
Choosing between managed and self-managed Kubernetes is a fundamental architectural decision.
The decision fundamentally comes down to control versus operational overhead. In my experience, this choice shapes not just your technical architecture but your team’s responsibilities and operational practices.
Managed Kubernetes services like EKS, AKS, and GKE handle control plane operations, such as handling master node provisioning, etcd backups, API server high availability, and cluster upgrades. When I deploy on managed services, I focus on workloads as they’re great for speeding up deployments, especially at scale.
In the case of self-managed Kubernetes, they are managed using kubeadm and K3s. They give complete control over every aspect of the cluster, from kernel parameters to etcd configuration. I’ve used self-managed clusters when specific compliance requirements, network configurations, or cost optimizations demanded this level of control.
The following table summarizes the difference between managed and self-managed Kubernetes.
| Managed | Self-Managed | |
|---|---|---|
| Control | Limited (provider manages control plane, upgrades, etc.) | Full (you manage everything, including control plane) |
| Responsibility | Provider handles control plane, some security patches, and basic monitoring | You’re responsible for all aspects: upgrades, security, monitoring |
| Cost | Pay for managed services (control plane fees, premium features); can be cost-effective for small/medium workloads | Only pay for infrastructure, but higher operational overhead |
| Automation | High (integrated with cloud services, auto-scaling, easy upgrades) | Manual (you must automate upgrades, scaling, and backups yourself) |
| Integration | Deep integration with cloud-native services (IAM, storage, monitoring) | Flexible, can integrate with any environment, including on-premises |
| Use Cases | Enterprises, teams wanting to focus on apps, not infrastructure | Custom environments, edge, air-gapped, or highly regulated workloads |
Single-Cluster vs. Multi-Cluster Architecture
The architectural decision between single and multi-cluster deployments has profound implications for how I design, deploy, and operate applications across different environments and requirements.
Single-cluster architectures provide simplicity and centralized control.
- Simplicity: A single cluster is easy to manage, with centralized control and resource pooling. It’s ideal for small teams, development, or when you don’t have strict isolation or geo-distribution requirements.
- Limitations: As the cluster grows, you may hit scalability or fault isolation limits. A failure can impact all workloads
However, multi-cluster architectures enable isolation, geo-distribution, and compliance requirements that single clusters cannot address.
- Isolation: Multi-cluster setups provide strong isolation between workloads, which is essential for security, compliance, or multi-tenant environments.
- Geo-Distribution: I use multi-cluster architectures to deploy workloads closer to users in different regions, improving latency and meeting data residency requirements.
- Compliance: Some regulations require data to stay within specific jurisdictions, which is easier to enforce with separate clusters
- Cross-Cluster Services and Federation: Managing services across clusters can be complex. I often use service meshes (like Istio) or tools like Calico Cluster Mesh to enable cross-cluster service discovery and traffic management
Multi-cluster also provides blast radius containment, that is, if one cluster fails, other clusters continue operating independently. This isolation is valuable in production environments where a single cluster outage could otherwise affect all services.
However, multi-cluster requires more sophisticated deployment pipelines, cross-cluster monitoring and logging, and careful network design. Organizations with global presence, strict compliance requirements, or high availability demands benefit from multi-cluster architecture.
| Feature | Single-Cluster Architecture | Multi-Cluster Architecture |
|---|---|---|
| Simplicity and Management | Easy to manage with centralized control and a single resource pool. Ideal for small teams or development environments. | More complex to manage; requires advanced deployment pipelines, networking, and monitoring across clusters. |
| Isolation | Limited isolation; workloads share the same cluster. | Strong isolation between workloads; suitable for multi-tenant, security-sensitive, or compliance-driven setups. |
| Scalability Limits | May face scalability or fault isolation limits as it grows. A failure can impact all workloads. | Highly scalable; failures in one cluster don’t affect others (blast radius containment). |
| Geo-Distribution | All workloads are in one location/region; not optimized for global latency. | Enables deployment of workloads closer to users in different regions, reducing latency and improving performance. |
| Compliance | Harder to enforce jurisdiction-based data storage rules. | Easier to comply with data residency laws by deploying clusters in specific regions. |
| Fault Tolerance | Single point of failure; outages affect all services. | Higher availability; if one cluster fails, others keep running independently. |
| Networking | Simple networking setup. | Requires careful cross-cluster networking design; often uses service meshes (e.g., Istio) or tools like Calico Cluster Mesh. |
| Best For | Small-scale projects, teams without strict compliance or geo-distribution needs. | Large organizations, global deployments, strict compliance needs, or high-availability production systems. |
Kubernetes Service Meshes: Istio vs. Linkerd vs. Consul
I believe service meshes are essential add-ons for Kubernetes environments, especially as microservices architectures grow in scale and complexity. It provides advanced traffic management, observability, and security features that go far beyond what’s available in Kubernetes networking.
A service mesh introduces a dedicated infrastructure layer for handling service-to-service communication. This layer is typically implemented using lightweight proxies (sidecars) injected alongside application containers. The result is a powerful set of capabilities:
- Advanced Traffic Management: Service meshes control traffic flow with features like intelligent load balancing, circuit breaking, retries, timeouts, and sophisticated routing (A/B testing, canary releases, blue-green deployments).
- Observability: They provide deep visibility into service interactions, automatically collecting metrics, logs, and distributed traces. This is invaluable for troubleshooting and performance tuning.
- Security: Service meshes enable strong security controls, including mutual TLS (mTLS) for encrypted service-to-service communication, fine-grained access policies, and service identity management.
Popular implementations like Istio, Linkerd, and Consul Connect each bring different strengths to service mesh deployment.
Istio
Istio is the most feature-rich and widely adopted service mesh. It excels at:
- Traffic Management: Fine-grained routing, traffic shifting, circuit breaking, and fault injection.
- Observability: Integrates with tools like Kiali and Grafana, providing automatic metrics, logs, and traces for all traffic.
- Security: Supports mTLS, strong authentication/authorization, and integrates with external policy engines.
- Service Discovery and Retries: Handles dynamic service discovery, automatic retries, and failover.
Linkerd
Linkerd is known for its simplicity and performance:
- Traffic Management: Offers load balancing, retries, and traffic splitting for canary deployments.
- Observability: Out-of-the-box dashboards with Prometheus and Grafana integration.
- Security: Provides automatic, zero-config mTLS for all service-to-service traffic.
- Service Discovery: Seamlessly integrates with Kubernetes service discovery.
Consul
Consul, from HashiCorp, is a service mesh with strong service discovery roots:
- Traffic Management: Supports granular routing and load balancing.
- Observability: Integrates with Prometheus and other observability tools.
- Security: Uses automatic TLS encryption and integrates with Vault for secrets management.
- Service Discovery: Excels at multi-cloud and hybrid environments, providing robust service discovery and identity management.
All three meshes handle service discovery, retries, metrics collection, and mTLS, but the choice depends on your environment’s complexity, performance needs, and existing toolchain.
However, remember that service meshes add complexity and resource overhead. The learning curve is steep, and debugging mesh-related issues requires understanding both Kubernetes and service mesh concepts.
I typically recommend starting with simpler solutions and gradually adopting service mesh capabilities as microservices complexity increases and the benefits justify the operational overhead.
Kubernetes Monitoring and Security Tools: Prometheus, Grafana, Falco, Kyverno, Aqua, Prisma
Monitoring and security are critical pillars of any Kubernetes deployment. I always recommend integrating robust external tools for both observability and runtime protection.
For monitoring, I rely heavily on Prometheus for metrics collection, Grafana for visualization, and enterprise solutions like Datadog for comprehensive observability.
- Prometheus: Prometheus is the go-to standard for Kubernetes monitoring. It scrapes metrics from cluster components and workloads, supports powerful queries (PromQL), and integrates natively with Kubernetes service discovery. Prometheus is often deployed via Helm and can be paired with AlertManager for alerting.
- Grafana: The go-to visualization tool for Prometheus data. Grafana lets me build rich dashboards and visualizations, making it easy to monitor cluster health and application performance. It’s also deployed via Helm and can be exposed securely for team access
- Datadog: A managed, cloud-based monitoring platform. Datadog’s agent runs as a DaemonSet, collecting metrics, logs, and events. It offers prebuilt dashboards, built-in alerting, and seamless integration with Kubernetes, making it a great choice for teams wanting a turnkey solution
Now, security tooling includes runtime protection with Falco, policy enforcement through Kyverno, and comprehensive scanning with Aqua or Prisma Cloud.
- Falco: An open-source runtime security tool that detects anomalous behavior in real time using kernel events. Falco generates alerts for suspicious activity, provides detailed audit trails, and continuously monitors for threats at runtime
- Kyverno: A Kubernetes-native policy engine. Kyverno lets me define and enforce security policies as code, generating alerts and audit logs for policy violations. It ensures that only compliant workloads are deployed
- Aqua Security: A comprehensive platform for container and Kubernetes security. Aqua provides vulnerability scanning, runtime protection, alerting, and detailed audit trails for compliance.
- Prisma Cloud: A cloud-native security platform offering runtime protection, vulnerability management, alerting, and audit trails across Kubernetes and cloud environments.
The integration of alerting, audit trails, and runtime scanning creates a comprehensive security posture. I’ve implemented alerting strategies that escalate based on severity and context, audit logging that captures all API interactions for compliance requirements, and continuous image scanning that identifies vulnerabilities before deployment.
Kubernetes Architecture Weaknesses and Challenges
While Kubernetes is powerful, it’s not without its challenges. Here are the most common weak points I encounter:
- Complexity of Managing Components: Kubernetes consists of many moving parts (API server, etcd, controllers, schedulers, kubelets, CNI/CSI plugins, etc.), making setup and ongoing management complex.
- Steep Learning Curve: The breadth of concepts (pods, services, deployments, CRDs, RBAC, network/storage plugins) can be overwhelming for new users.
- Configuration Drift: Manual changes and lack of declarative management can lead to clusters drifting from their intended state, causing inconsistencies and potential outages.
- Networking Issues: Misconfigured services, network policies, or CNI plugins can result in connectivity problems that are hard to diagnose.
- RBAC and Policy Enforcement Gaps: Overly permissive RBAC settings or a lack of policy enforcement can expose clusters to security risks. Regular audits and policy engines like OPA Gatekeeper or Kyverno are essential
Kubernetes Security Best Practices: RBAC, Policies, Network Segmentation, Registries
Security in Kubernetes requires a multi-layered approach that addresses access control, workload isolation, network security, and image integrity. I’ve learned that security isn’t an add-on; it must be designed into the architecture from the beginning.
Here’s how I approach it:
RBAC and Namespaces
RBAC and Namespaces provide the foundation for access control and workload isolation.
- RBAC (Role-Based Access Control): I use RBAC to enforce the principle of least privilege, defining granular permissions for users and service accounts. Regular audits help ensure no one has more access than necessary
- Namespaces: Namespaces provide logical isolation within a cluster, allowing me to separate environments (dev, staging, prod) and limit the blast radius of potential breaches
OPA Gatekeeper or Kyverno
Pod Security Policies were deprecated, so I now use OPA Gatekeeper or Kyverno for pod-level security controls.
- Pod Security Policies (PSP): PSPs were used to restrict pod capabilities, but are now deprecated and removed in recent Kubernetes versions.
- OPA Gatekeeper / Kyverno: I now use OPA Gatekeeper or Kyverno to enforce security policies, such as restricting privileged containers, enforcing image provenance, and requiring resource limits
API Access Controls
API access controls extend beyond RBAC to include authentication, authorization, and audit logging.
- Authentication and Authorization: I ensure only authenticated users can access the API, using tokens, certificates, or external identity providers. RBAC is used for fine-grained authorization
- Network Segmentation: I restrict API server access to trusted networks and avoid exposing it to the public internet
Secure Image Registries
Secure image registries are critical for supply chain security. I use private registries with vulnerability scanning, image signing, and admission controllers that prevent deployment of images that don’t meet security standards.
- Image Scanning: I integrate image scanning tools (e.g., Trivy, Falco) into CI/CD pipelines to catch vulnerabilities before deployment
- Verified Sources: Only images from trusted, up-to-date sources are used, and I enforce image signing and verification.
- Registry Security: All registry access is encrypted (HTTPS), and access is tightly controlled.
Network Policies
Network Policies provide microsegmentation capabilities that limit communication between pods and external resources.
- Traffic Control: I use Kubernetes Network Policies to restrict pod-to-pod communication, enforcing least-privilege networking and isolating sensitive workloads
- Namespace Isolation: Network policies are also used to enforce isolation between namespaces.
Conclusion
Kubernetes is a modular, powerful, and highly extensible platform. Its architecture allows for tailoring networking, storage, security, and observability to the organization’s needs.
However, this flexibility comes with complexity; careful design, automation, and security best practices are crucial to success.
As a next step, you can
- Experiment with Kubernetes using local tools like Minikube or Kind for development and testing.
- Explore managed Kubernetes services for production use cases.
- Integrate monitoring, security, and policy enforcement tools early in your journey to build a secure and observable platform from day one.
FAQs
What are the main components of Kubernetes?
Kubernetes consists of control plane components (API Server, etcd, Controller Manager, Scheduler, Cloud Controller Manager) that manage the cluster, and worker node components (Kubelet, Kube Proxy, Container Runtime) that run workloads.
What’s the difference between a Pod and a Deployment?
A Pod is the smallest deployable unit in Kubernetes, holding one or more containers. A Deployment manages multiple Pods, ensuring the desired number is running, enabling scaling, and handling updates automatically.
Is Kubernetes suitable for small teams?
Yes, especially when using managed Kubernetes services that reduce operational complexity. However, self-hosting Kubernetes can be challenging for small teams without DevOps expertise.
What’s the difference between the control plane and worker plane?
The control plane is the brain of Kubernetes, making scheduling and scaling decisions. The worker plane (nodes) runs the actual application workloads in Pods based on control plane instructions.
Do I need to use a service mesh with Kubernetes?
Not always. Kubernetes’s native networking often suffices for simple applications. A service mesh is most useful in complex microservice environments requiring advanced routing, observability, and security.
Manasa M
Technical Content Editor
Manasa is a Technical Content Editor at RedSwitches, known for turning complex technical concepts into clear, engaging content. With a background in copy editing, sub-editing, and technical writing, she shapes the blog's guides for accuracy, readability, and search performance.
Ubuntu vs Linux: Key Differences Explained
Linux is the kernel, while Ubuntu is a complete operating system built on it. This guide breaks down their key differences, use cases, and when to choose each.
Reduce Docker Image Size: Best Practices to Slim Your Images
Docker image size can become a serious issue as you add more code to the image. Learn how to reduce Docker image size and optimize Dockerfiles for production to speed up CI/CD pipelines and improve container efficiency.
Best Linux Distros 2026, Full Guide for Beginners, Developers, Gamers & Servers
Match your hardware, workflow, and skill to the right Linux distro in 2026. Compare 23 top picks, Mint, Ubuntu, Fedora, Arch, Bazzite, covering beginners, developers, gamers, and servers.
Power Your Next Project With Bare Metal
10 min delivery, zero setup fees, and 24/7/365 human engineers across 20+ global locations.