
Bandwidth and Usage
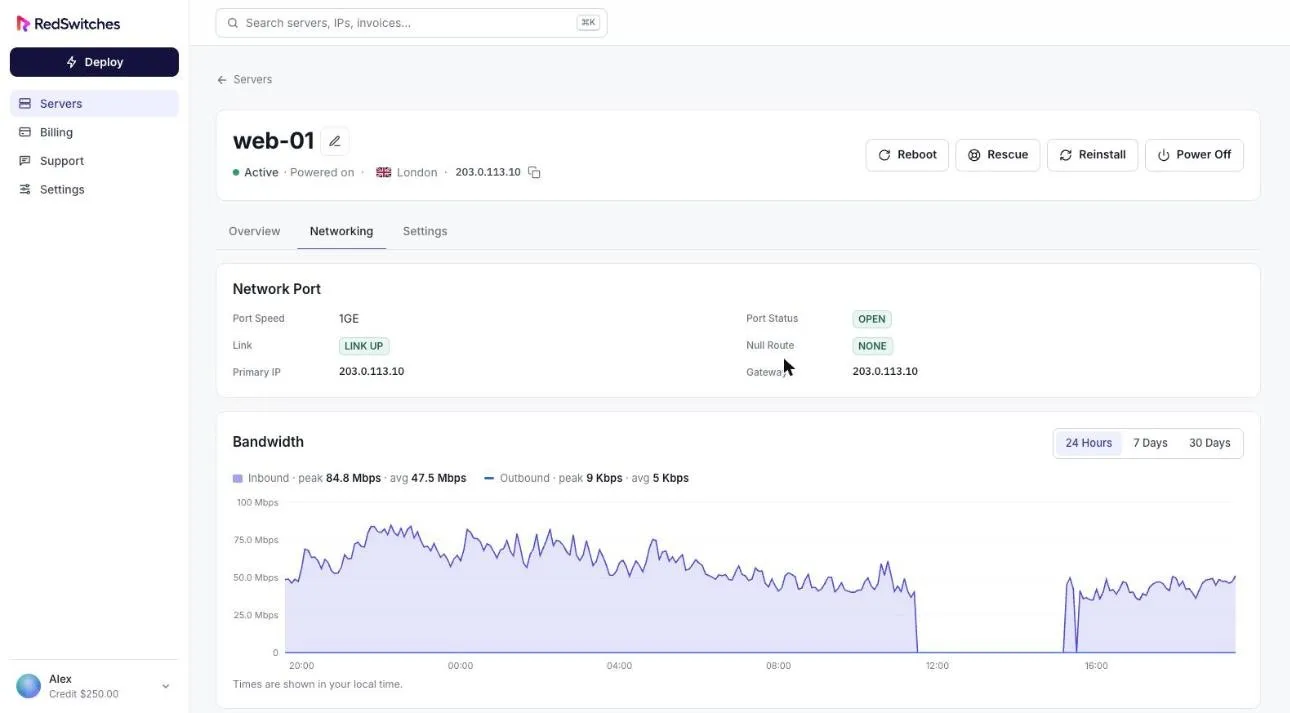
You always know where you stand on traffic. The Networking tab of each server shows its port, live traffic and how much of your allowance you have used.
Network port
Section titled “Network port”Where reported, the Network Port card shows:
| Field | Meaning |
|---|---|
| Port Speed | The speed of the switch port |
| Port Status | Whether the port is open |
| Link | Whether the link is up |
| Null Route | Whether the IP is currently null routed |
| Primary IP | The server’s main IP address |
| Gateway | The gateway for that address |
Bandwidth graph
Section titled “Bandwidth graph”The graph plots inbound and outbound traffic, with the peak and average for each. Switch between 24 Hours, 7 Days and 30 Days. Times are shown in your local time.
For a new server, the graph starts from the day the server became yours.
Data usage
Section titled “Data usage”| Figure | Meaning |
|---|---|
| Data Used | Traffic so far this period against your allowance. Unmetered plans show no limit |
| 95th Percentile | Your 95th percentile rate for the period |
| Peak In and Peak Out | The highest hourly average in each direction |
A breakdown below shows inbound and outbound totals by day.
Change your bandwidth
Section titled “Change your bandwidth”Bandwidth options are chosen when you deploy. To change the option on a running server, open a support request under Order Or Add-On.