When things go wrong with any server, the investigation often starts with the logs.
These server logs contain critical information about the events that occurred up to the occurrence of the incident. Like all servers, NGINX maintains logs that server admins and forensic investigators use to find out what went wrong and how to begin fixing things.
This blog will introduce you to NGINX logs, how to enable these logs, and how to interpret severity levels.
Let’s start with a short introduction to NGINX and quickly run through the installation process.
Table Of Content
- What is NGINX?
- How to Install NGINX on Linux?
- What Are NGINX Logs?
- What Are NGINX Access Logs?
- What Are NGINX Error Logs?
- Conclusion
- FAQs
What is NGINX?
Originally released in 2004 by Igor Sysoev, NGINX is a popular web server that could double as a reverse proxy, mail proxy, HTTP cache, and load balancer. It is open-source and free to use under a BSD license. Currently, it powers about 30% of the global web servers.
How to Install NGINX on Linux?
If you don’t already have NGINX up and running, follow these steps to install NGINX on a CentOS 7 machine.
Step # 1: Get and Install NGINX Repository
Before proceeding with the NGINX installation, add the EPEL repository to the server by logging in via SSH. For this, use the following command:
#yum install epel-release
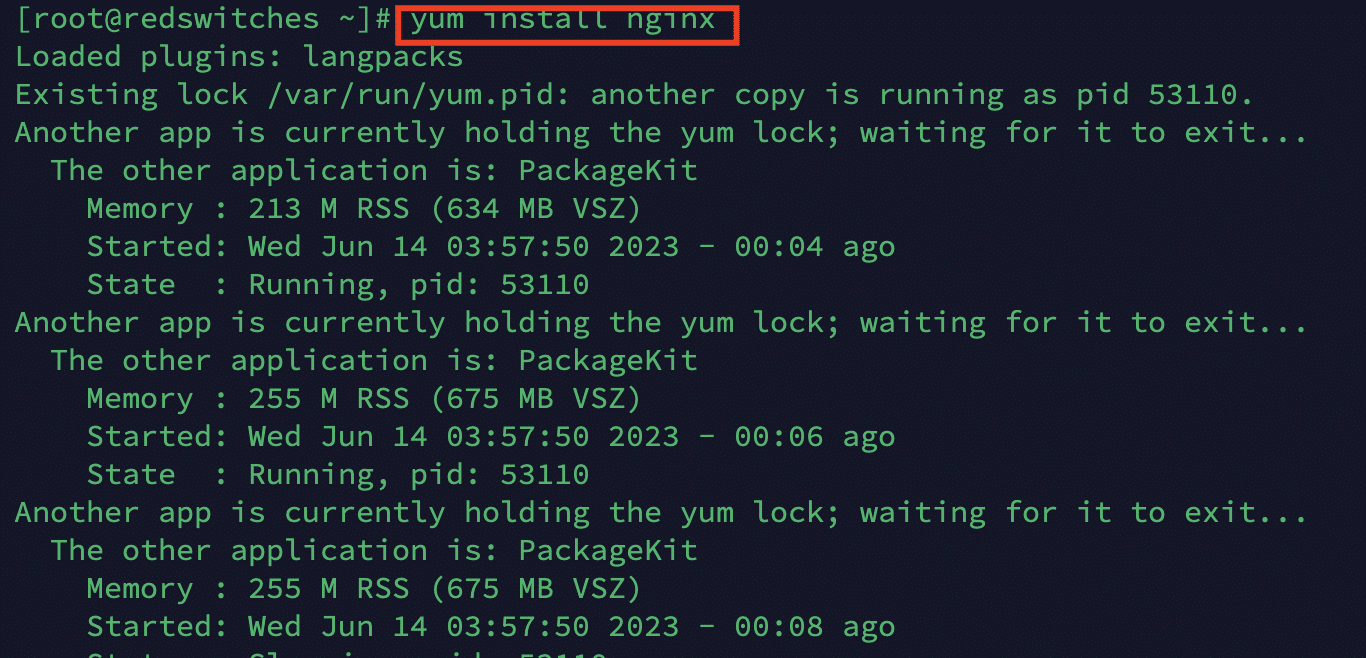
Next, use the following command to get and install NGINX on the server machine:
# yum install nginx
Step # 2: Start the NGINX Service
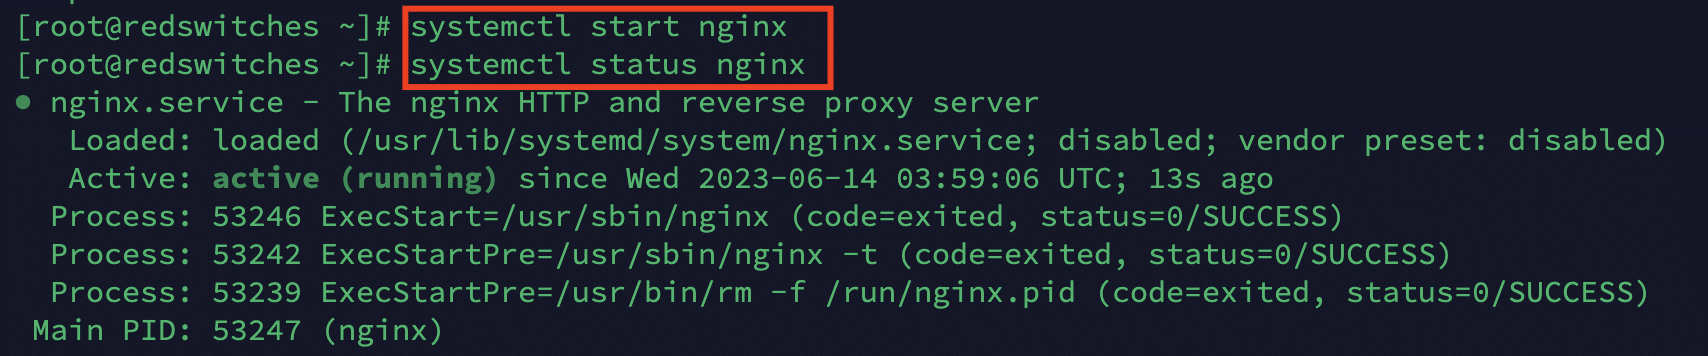
Once installation is complete, start the NGINX service with the following command:
# systemctl start nginx
You’ll not get any indication of whether the command was successfully executed. You need to run the following command to check the service status and whether NGINX is up and running.
# systemctl status nginx
Step # 3: Enable NGINX Launch at Server Start
In most cases, you would want the NGINX to start automatically when the server starts or reboots. For this, use the following command:
# systemctl enable nginx

Now that you have an operational NGINX server, let’s discuss NGINX logs in detail.
What Are NGINX Logs?
An NGINX log is a custom file that the web server generates and maintains. When NGINX processes HTTP requests and serves web content, it generates log entries that provide valuable information about the server’s activity, outcomes, and requests.
These logs are essential for monitoring and troubleshooting the NGINX server. Administrators can gain insights into the server’s performance, detect potential security threats, track user activity, and identify and resolve issues that may arise.
Administrators can understand traffic patterns, identify bottlenecks, monitor server health, and optimize server configurations by analyzing these log files.
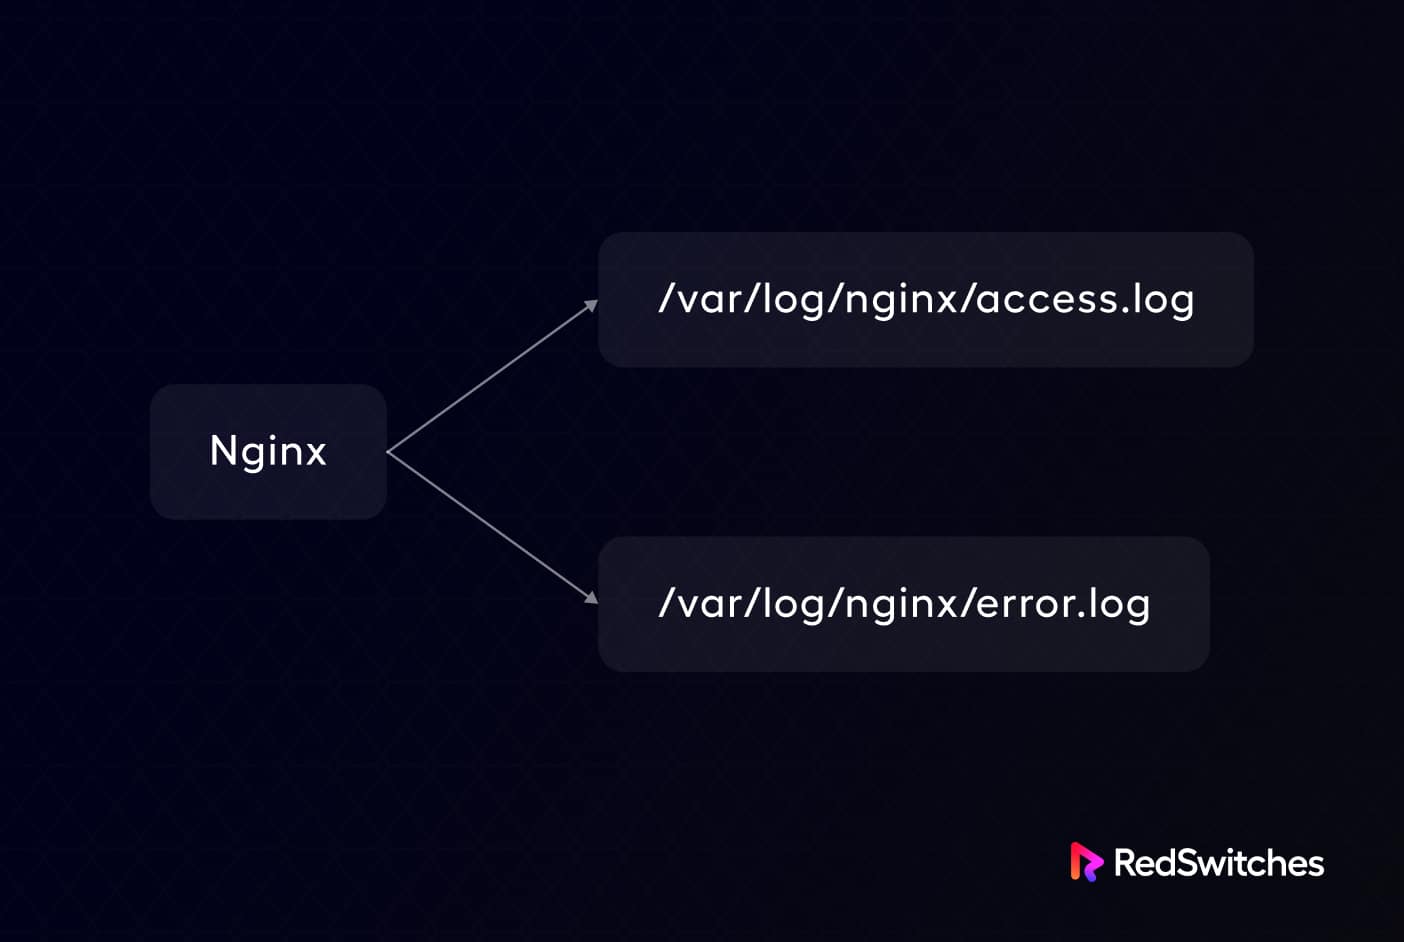
During the operation, NGINX produces the following logs:
Access Logs
These logs record information about incoming HTTP requests to the server. They include details such as the client’s IP address, the timestamp of the request, the requested URL, the HTTP status code, and the size of the response.
Error Logs
Error logs capture information about any errors or issues the NGINX server encountered while processing requests. This NGINX log can help when looking into issues like misconfigured settings, failed connections, or errors in executing server-side scripts.
Rewrite Logs
When enabled, this class of NGINX log can help you monitor and examine the server’s URL rewriting behavior. These logs show which rules were activated and how the original URL was changed throughout the rewriting process.
The Rewrite logs contain information such as the original URL, the rewritten URL, the specific rewrite rule used, and any related variables or conditions.
Admins use these logs to debug any unexpected behavior, verify that the appropriate rewrite rules are applied correctly, and troubleshoot URL rewriting problems.
SSL/TLS Logs
The SSL/TLS log contains information about the encrypted connections. This NGINX log is useful in monitoring and analysis of the safety and proper operation of encrypted connections. You can use these logs to track certificate validity, diagnose SSL/TLS-related problems, find security flaws, and monitor SSL/TLS performance.
Configuring NGINX Logs
You can configure an NGINX log’s exact format and location by editing the NGINX server configuration file (nginx.conf).
So, while the default NGINX log file location on Linux systems is often /var/log/nginx/, the actual location can vary depending on the specific distribution and configuration.
As server administrators, you must set up the appropriate log formats and directives in the NGINX configuration file to enable logging.
Furthermore, you can specify the log level, log file location, and log format customization based on your needs.
What Are NGINX Access Logs?
Access logs for the NGINX web server contain data about incoming HTTP requests.
These logs offer insights into the server’s operation and the requests it responds to during the operations. This NGINX log contains critical information such as the IP address of the clients, the request’s timestamp, the URL that was requested, the HTTP status code, and the size of the response.
Enable NGINX Access Log for Individual Virtual Hosts
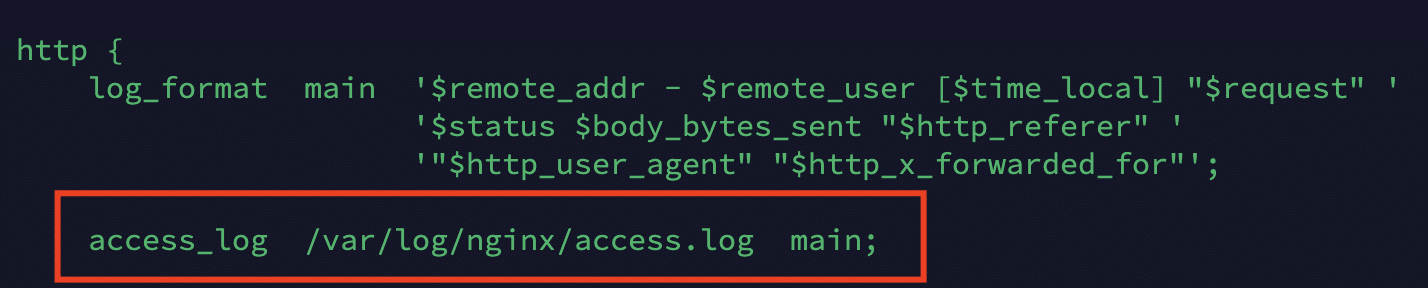
A look at the HTTP section of the NGINX configuration file shows that the access log is enabled by default. However, this entry assumes that there’s a single log file for all the virtual hosts on the server.
The best practice here is to keep separate access logs for each virtual host.
To accomplish this, you must add a different access log directive in the server portion of the HTTP section.
Here’s an example:
access_log /var/log/nginx/access.log;
server {
listen 80;
server_name testdomain.com
access_log /var/log/nginx/testdomain.access.log;
...
...
}
Once you add the above entry into a new file named /var/log/nginx/testdomain.access.log ( for the test domain), you need to reload or restart the NGINX service so that these settings will take effect.
Now, you can check the logs by using the following command:
# tail -f /var/log/nginx/testdomain.access.log
Location of the Access Logs
The NGINX server configuration file allows for customization of the NGINX access log format (nginx.conf).
The customizations include the logs’ format and the inclusion of any specific fields as determined by the administrators.
NGINX access logs can be set up in different formats, such as JSON or Syslog. We recommend opting for these formats if you export access logs for use with third-party log analysis tools. Note that the default format for the access logs is plain text.
Depending on the server configuration, NGINX access logs may be located at various places. On Linux systems, the default log file path for access logs is usually /var/log/nginx/access.log, though, as mentioned earlier, it may vary depending on the distribution and NGINX configuration.
What Are NGINX Error Logs?
An NGINX web server’s error logs record details of any errors or problems it faces while handling requests.
These logs give administrators helpful information about the server’s error handling and management so that they can identify and fix issues.
NGINX error logs are versatile and record a wide range of information, including:
- Errors relating to failed client connections, including “connection refused” and “connection timed out.”
- Errors relating to a failure in processing requests, such as incorrect or malformed requests.
- Server operation errors. This is a distinct category of errors that include errors that return 5xx HTTP statuses. These errors arise from failure to complete a request, misconfigured or malfunctioning server configuration, scripts, or backend applications.
Enable NGINX Error Logs for Individual Hosts
By default, an NGINX server has a single error log that contains details of all the errors the server encounters.
However, a better way is to have separate error logs for each virtual host on the server. This setup simplifies post-incident investigation because you can go straight to the error log of the virtual host in question and get to the source of the problem without drowning in data.
You must override the error log directive in the server section to keep separate error logs for each virtual host.
The following example demonstrates this by overriding the error log directive in the server section of the NGINX config file:
http {
...
...
error_log /var/log/nginx/error_log;
server {
listen 80;
server_name testdomain1.com;
error_log /var/log/nginx/testdomain1.error_log warn;
...
}
server {
listen 80;
server_name testdomain2.com;
error_log /var/log/nginx/testdomain2.error_log debug;
...
}
}
As you can see from the above example, we created two error logs, one for each virtual machine.
Location of Error Logs
The NGINX server configuration file (nginx.conf) allows the configuration of the NGINX error log format and location to be configured. Administrators can alter the log format and specify the desired path for the log files. Note that NGINX error logs are typically stored in plain text files by default.
On Linux systems, /var/log/nginx/error.log is frequently the default location for NGINX error logs, though the exact location can change depending on the distribution and NGINX configuration.
NGINX Error Logs Severity Levels
Log severity levels are a simple methodology of categorizing issues to separate critical problems from everyday stuff. Organizations can come up with their severity level scheme to plan their operations. However, many organizations prefer to follow this standard severity level scheme that allows simple categorizing of issues.
- Alert: Warnings of critical problems.
- Error: Something went wrong. For instance, the server encountered a problem while processing a page.
- Warn: A warning sign informing you to take a closer look.
- Emerg: Emergency messages are sent out when a system may be unstable.
- Crit: Urgent needs that require immediate attention.
- Notice: Ignore this specific log notice.
- Info: simply a message containing information you might find helpful.
- Debug: Information used during debugging to locate errors.
Conclusion
Nginx logs are essential for tracking and troubleshooting web server activity. They offer valuable insights into user behavior, server performance, and potential security risks.
System administrators, developers, and security teams can gather helpful information from NGINX logs to improve server performance, troubleshoot problems, and strengthen website security. Regular monitoring and analysis of NGINX logs can ensure an efficient and safe web server environment.
If you wish to get the full benefit of your NGINX server, RedSwitches offer the best bare metal servers in the industry. All our servers come with complementary technical support that ensures the smooth operation of your NGINX servers.
If you need access to the NGINX server logs, raise a support ticket now and get a prompt response.
Frequently Asked Questions
Q-1) What types of logs does NGINX produce?
Access logs and error logs are the two main categories of NGINX logs. While error logs record error messages and warnings encountered during the request processing, access logs document the specifics of incoming requests.
Q-2) Can I disable NGINX’s logging?
Logging can be disabled by changing the server configuration. The access log directive can be removed or commented out to disable access logging. The error log directive can also be modified to turn off error logging.
Q-3) How do I change the NGINX log format?
NGINX enables log format customization by modifying the log format directive in the configuration file. You can define the desired format by specifying placeholders for log variables like the remote IP address, requested URL, and response status.
Q-4) Are NGINX logs appropriate for monitoring and analysis?
NGINX logs are frequently used for server monitoring and incident analysis. They offer helpful data on website traffic, user behavior, performance indicators, and possible security problems. NGINX logs can be parsed and used as a source of information using various tools and techniques for log analysis.