Key Takeaways
- Monitoring network latency is essential for optimal performance.
- Measures the delay of device-to-device communication.
- Ensures the transmission of data on time.
- Finds bottlenecks, adjusts parameters, and upholds SLAs.
- Three categories: latency in processing, transmission, and queuing.
- Factors include software, device capability, congestion, and physical distance.
- Best practices include proactive optimization, teamwork, and benchmarking.
- Examples from the real world include slow games, sluggish page loads, and sluggish video conferences.
The fight against latency is unbeatable in digital domains. Milliseconds are the currency of competition. Imagine yourself enjoying your favorite TV show on a streaming service. Your fingers tingle to outwit opponents in an online game. Or maybe you’re waiting on vital information to make a potentially life-saving decision.
The undefinable force of latency is present in every situation. It poses a threat to the smooth operation of our digital experiences. Every millisecond counts here. Knowledge of unseen delays can mean the difference between success and failure.
This blog takes us on a journey into the core of latency monitoring. It helps us comprehend its subtleties better. We can solve its secrets and find the tactics to vanquish this elusive opponent. Thus, get ready as we dive further into latency monitoring and speed supremacy.
Table of Contents
- Key Takeaways
- What is Network Latency Monitoring?
- Importance of Monitoring Latency or Performance Monitor
- Factors Influencing Latency Monitoring
- Business Implications of High Latency
- Techniques for Latency Monitoring
- How to Implement Latency Monitoring
- Best Practices for Effective Latency Monitoring
- Recognize the Essential Elements of Your System
- User Experience Requirements
- Specify Latency Metrics
- Track Latency from Start to Finish
- Set Baselines
- Establish Acceptable Performance Thresholds
- Apply Historical Analysis
- Link Latency to Additional Measures
- Execute Dispersed Tracing
- Enhance Efficiency
- Real-World Examples of Latency Issues
- Conclusion
- FAQs
What is Network Latency Monitoring?

Credits: Freepik
Network latency monitoring measures the delay when sending data across a network. It also evaluates the delay. In the context of a network, latency is the amount of time, usually expressed in milliseconds (ms). It’s the time a data packet travels from its source to its destination and back.
Network latency monitoring tracks many metrics to check a network’s performance and health. These include round-trip time (RTT), packet loss, jitter, and throughput. Network administrators and IT specialists can find bottlenecks. They can resolve connectivity problems and enhance network performance. They do this to guarantee efficient and error-free data transfer by monitoring latency.
You can monitor network latency using various tools and methods. These range from straightforward ping tests to complex network monitoring programs. They offer in-the-moment insights into network functionality.
By identifying and resolving latency problems, these monitoring solutions help businesses reduce downtime. They also improve their networks’ general responsiveness and dependability.
Importance of Monitoring Latency or Performance Monitor
In this section, we will learn the importance of Latency Monitoring in detail.
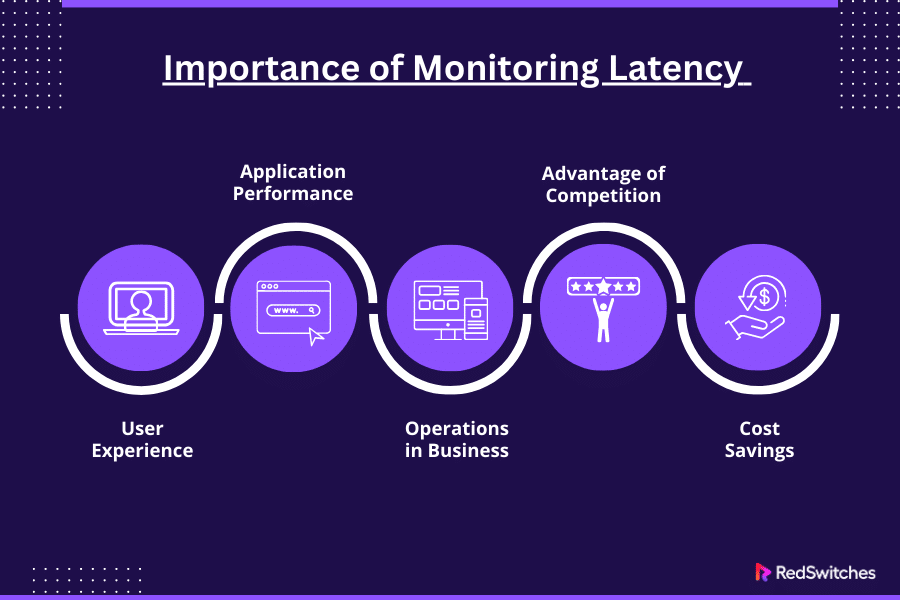
User Experience
Applications’ and services’ responsiveness is impacted by latency. Users expect quick loading speeds when using web apps, playing online games, or streaming video content. They also expect seamless user experiences.
Delays in data transfer caused by high latency can cause buffering, lag, and sluggish loading times. Users may become irate over this and stop using your platform or application.
Organizations may ensure a great user experience and customer satisfaction. They can rapidly identify and resolve performance issues using latency monitoring.
Application Performance
Latency can impact critical applications and services. These include financial trading platforms, healthcare systems, and e-commerce websites.
In high-frequency trading situations, delays of as little as milliseconds can cause large losses in value. Delays in obtaining medical records or handling data might compromise patient safety and treatment.
Organizations can analyze the performance of critical applications. They can monitor latency to identify any irregularities or slowdowns. These issues might affect output or revenue.
Operations in Business
Latency can affect business operations and productivity. This is especially true in sectors like manufacturing, banking, and telecommunications. These sectors depend on real-time data processing and transmission.
Slow network connections and high latency can impede employee collaboration and communication. This can cause delays in project delivery and decision-making.
By monitoring latency, businesses can detect and fix network problems. They can maximize resource allocation. And can guarantee seamless operations across dispersed teams and locations.
Also read Everything About eCommerce Dropshipping
Advantage of Competition
Speed and responsiveness are crucial differentiators for companies. They seek a competitive edge in today’s hyper-connected environment. Businesses that provide prompt and dependable services have an advantage over their competitors.
Improving network performance and monitoring latency can help businesses attract new customers, keep current ones, and enhance their brand.
Low-latency networks also open up new avenues for innovation and expansion. They help adopt cutting-edge technologies like edge computing, cloud computing, and the Internet of Things.
Cost Savings
Organizations can find inefficiencies in their network infrastructure. They can maximize resource use by monitoring latency.
Businesses can minimize downtime, cut operational costs, and optimize their IT infrastructure’s return on investment (ROI) by reducing latency and improving network performance.
Proactive latency monitoring can also help avoid expensive outages and service interruptions. It saves businesses money and time.
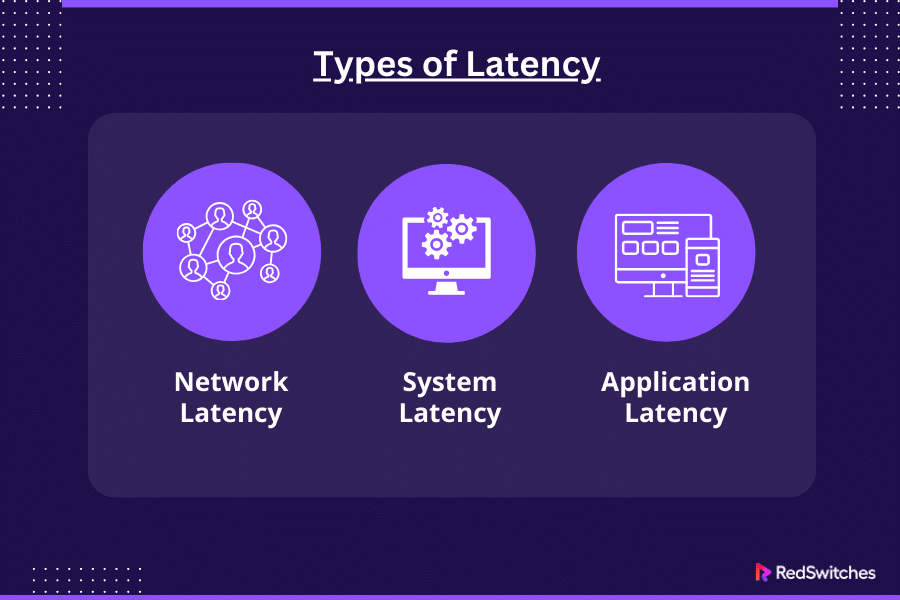
Types of Latency
In this section, we will understand the Types of Latency in detail.
Network Latency
Network latency, often called network delay, is a key component that affects how well computer networks run. It also affects how responsive they are when communicating.
It includes the time lag when data packets go from one place to another and back again. The delay is affected by variables like the physical separation between network devices. It is also affected by the speed at which data is transmitted across the network medium. And the processing time at intermediary network devices, like switches and routers, also affects the delay.
System Latency
System latency is the delay caused by a computer system or device’s hardware and software components. It occurs when actions or processes are carried out. It includes several variables: disc latency, memory latency, and processing latency.
The time it takes a system to carry out calculations or execute instructions is known as processing latency. Several variables affect it. These include CPU speed, the complexity of the instructions, and the capability of parallel processing.
Memory hierarchy, access patterns, memory speed, and other factors can all impact memory latency. Memory latency is the length of time it takes the system to access data stored in memory.
Application Latency
Application Latency refers to users’ time lag when utilizing software programs or services. It includes the time an application takes to receive input from the user and provide a response.
The term “user interface latency” describes how long it takes for a user interface to react to inputs from the keyboard or mouse. This depends on rendering, event handling, and input processing.
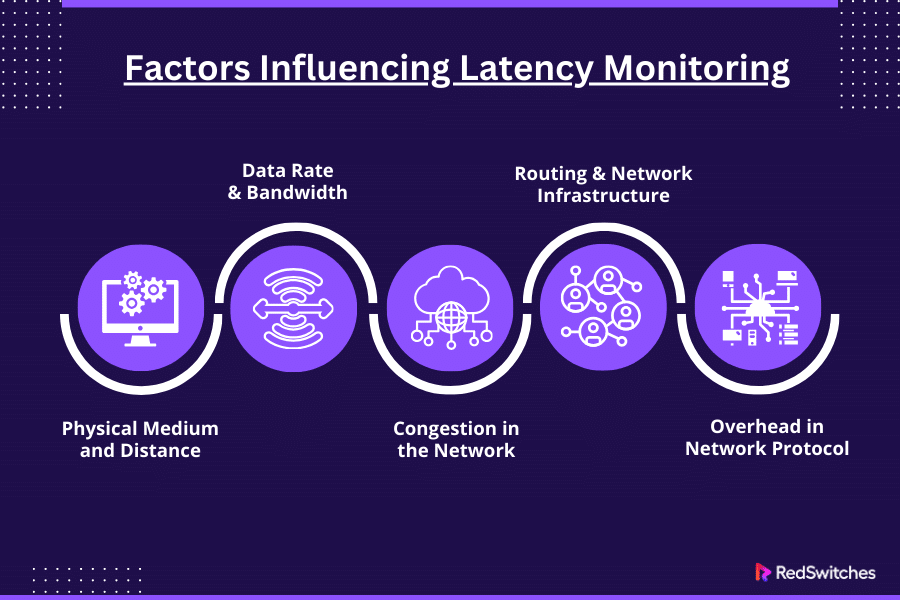
Factors Influencing Latency Monitoring
In this section, we will discuss the factors influencing Latency.
Physical Medium and Distance
The physical separation between network devices determines latency. Data transmission takes time. This is because the physical medium, such as copper wires, fiber-optic cables, or wireless channels, has to send the data.
We know the time it takes for signals to move from one place to another as propagation delay and longer distances cause this delay to increase. This leads to higher latency. In general, fiber-optic cables are less late than conventional copper wires. Dedicated servers may be geographically distant from users or other network components, leading to increased propagation delay and higher latency.
Data Rate and Bandwidth
The greatest data transfer rate over a network connection is bandwidth, measured in bits per second (bps) or megabits per second (Mbps). Dedicated servers with higher bandwidth capabilities can facilitate faster data transmission and potentially lower latency.
Greater bandwidth enables more data to be transferred in a given amount of time. This results in faster data transmission and lower latency. However, network congestion and packet loss could also affect latency. Bandwidth alone does not guarantee low latency.
Congestion in the Network
When there is an overwhelming demand for network resources, network congestion arises. It increases latency and causes delays in data transmission. Dedicated servers may experience congestion during peak hours or periods of network overload.
Packets wait in buffers at network equipment like routers and switches during periods of high traffic. This occurs during peak hours or network overload. They may encounter queuing delays. This queuing delay causes reduced network throughput and increased latency.
Also read Exploring the Basics of Hosting Bandwidth
Routing and Network Infrastructure
The layout and setup of network hardware, such as switches, routers, and cables, can affect latency.
Inefficient routing paths, network topology, and network configuration choices can add latency. These may cause delays in packet forwarding and processing. Inefficient routing paths and network topology choices can introduce additional latency for dedicated servers.
Minimizing latency can enhance a network’s performance. Effective routing protocols and optimizing network infrastructure can, too.
Overhead in Network Protocol
Network protocols add data packet overhead. This can raise latency because it requires longer processing and transmission times. Dedicated servers may experience latency due to protocol overhead, especially during tasks like error detection, flow control, and congestion management.
Protocols like TCP (Transmission Control Protocol) have features that increase overhead and latency. These features include error detection, flow control, and congestion management.
Use optimized protocols and compression techniques to reduce latency and enhance network efficiency. Also, minimize protocol overhead.
Business Implications of High Latency

Credits: Freepik
After discussing the Latency Monitoring, let’s discuss the business implications of High Latency.
Adverse Effect on the User Experience
Slow reaction times, data transmission lags, and buffering in apps and services are all consequences of high latency. This immediately negatively affects the user experience, which irritates and dissatisfies clients.
High latency can cause consumers to leave platforms. It also reduces engagement and retention rates in sectors like e-commerce, online gaming, and video streaming. This is especially true where speed and responsiveness are crucial.
Decreased Efficiency and Productivity
High latency causes employee communication and collaboration tools to function more. This impacts corporate operations’ productivity and efficiency.
Remote work environments can delay decision-making, project cooperation, and job completion. This happens when teams depend on real-time communication and file sharing.
High latency can lead to performance degradation and lower usability of productivity tools. This includes CRM platforms, cloud-based apps, and enterprise resource planning (ERP) systems.
Also read Webflow vs WordPress: The Future of Web Design in 2024
Effect on Support and Customer Service
High latency can impede customer service and support operations. It leads to delays in response times and the timely resolution of client inquiries and concerns.
In the telecom sector, customer service depends on quick contact and troubleshooting. Elevated latency might hinder the ability to offer prompt help. It might also hinder addressing service-related issues.
High latency can cause poor customer service. This can lead to inadequate evaluations, client turnover, and harm to the company’s reputation and brand image.
Also read 8 Quick Fixes to Troubleshooting ERR_TOO_MANY_REDIRECTS
Techniques for Latency Monitoring
Now, let’s focus on the tools and techniques for Latency Monitoring.
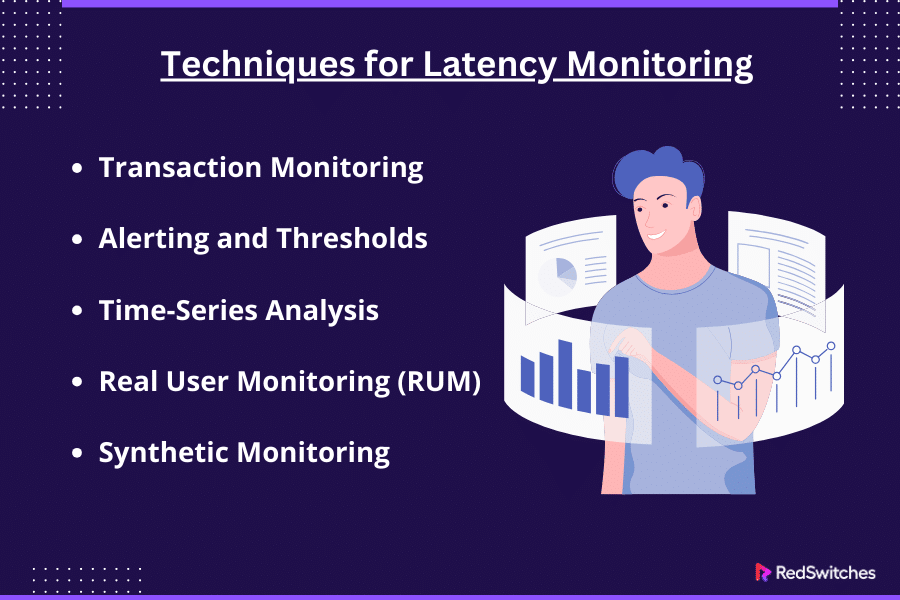
Transaction Monitoring
In your application, transaction monitoring tracks the latency of specific transactions or workflows. You can discover running components. Then, optimize them for reduced latency. Do this by instrumenting critical transactions and monitoring their reaction times.
Alerting and Thresholds
You can check for performance problems by setting up notifications. The system bases the notifications on pre-established latency thresholds. Alerts can notify administrators. They can also automate corrective action when latency is above a predetermined threshold.
Time-Series Analysis
When we examine time-series data of latency measures over an extended period, we can see trends and patterns in system performance. You can see performance degradation or improvement by visualizing latency data. Compare it with other metrics, such as CPU use or request rates.
Real User Monitoring (RUM)
RUM measures application latency from the viewpoint of end users interacting with it. By instrumenting client-side code, you can gather information on page load times, AJAX requests, and other user behaviors. You can also use browser APIs.
Synthetic Monitoring
Synthetic monitoring mimics user interactions with your application. It tests latency under controlled settings. Synthetic monitoring offers insights into system performance. It does this by creating fake queries and timing response times.
How to Implement Latency Monitoring

Credits: Freepik
To measure and analyze the time it takes for your system to reply to requests or finish operations, you must follow a few stages to implement latency monitoring. Here is a generic how-to for putting latency monitoring into practice:
Establish Metrics and Goals
Decide which latency metrics to track and what performance thresholds or goals you will accept. Response time, processing time, and network latency are common latency measures. When defining goals, consider the essential elements of your system and the demands on the user experience.
Instrumentation
Instrument your application code to get latency metrics at crucial junctures in the request processing pipeline. Documenting the beginning and ending timings of particular actions may entail adding logging statements, timestamps, or performance counters. When writing instrument code, use a standard procedure for all the various parts of your system.
Employ Monitoring Tools
Pick the right monitoring tools and frameworks to gather and examine latency data. These could be logging systems, specialized monitoring programs, or APM tools. Choose tools with real-time visibility and support for your selected metrics. The tools should also be able to analyze historical data.
Set up Logging and Tracing
Configure logging and tracing mechanisms to get comprehensive request processing and latency data. Use organized logging formats to guarantee uniformity and ease of analysis. You can follow requests across different layers if your system has many services or components. Turn on distributed tracing.
Also read 17 Best Security Penetration Testing Tools The Pros Use
Establish Alerts and Thresholds
Establish alerting rules in response to performance metrics abnormalities or predetermined latency thresholds. Configure alarms to warn administrators or start automated reactions. The alarms should go off when there is more latency than is reasonable. Adjust alerting thresholds based on process importance and user impact.
Best Practices for Effective Latency Monitoring
This section will discuss the best practices for Effective Latency Monitoring.
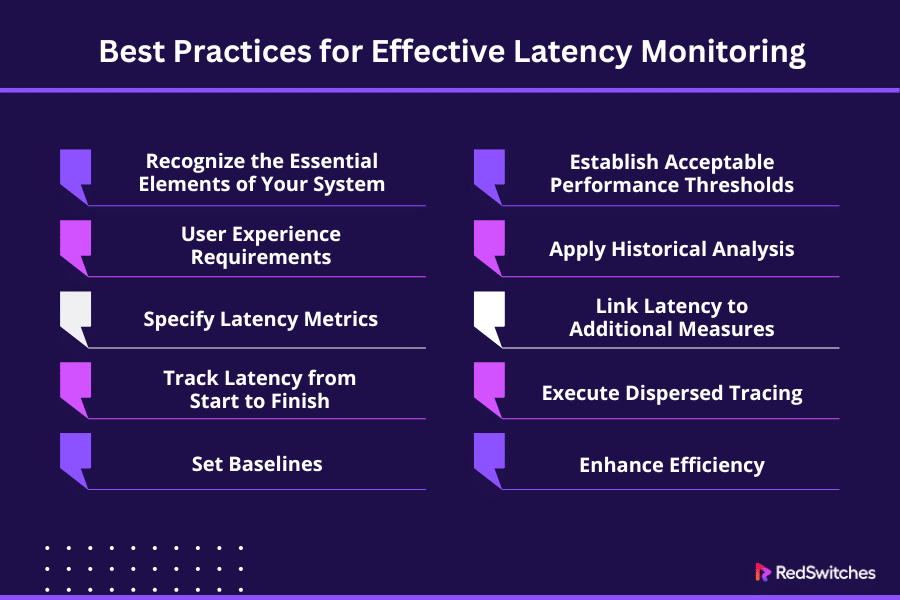
Recognize the Essential Elements of Your System
Understanding your system’s architecture and components before implementing latency monitoring is essential. Determine which essential elements affect the system’s performance. This includes frontend servers, backend databases, third-party services, and network infrastructure.
You can focus on regions most likely to affect performance. Focus your monitoring efforts by recognizing the essential components of your system. Focus your efforts on the key components of your system. This will ensure that you track latency effectively.
User Experience Requirements

Credits: Freepik
Consider end users’ needs and expectations of system performance. Recognize the permissible latency levels for your application’s various interactions and transactions.
A data processing pipeline might need a different latency than a real-time messaging application. The messaging application might need minimal latency for message delivery.
The user experience standards also assess system performance. They also establish the allowable range of latency. You can ensure that system performance meets user needs and satisfaction. Coordinate latency monitoring with user expectations.
Specify Latency Metrics
Determine which latency metrics are most pertinent to your application and performance objectives. Typical latency measurements consist of:
Response Time: The amount of time it takes for a system to react to an inquiry or communication from a user.
Processing Time: The amount of time the system needs to handle a task or process a request.
Network latency is the time lag that occurs when several system components communicate over a network.
Database query times: The amount of time needed to run queries via databases to get or update data.
Track Latency from Start to Finish
Track latency from the user’s point of interaction. Track it through the backend’s processing and response delivery. This entails monitoring latency across the whole request lifetime. This includes response generation, server-side processing, network connectivity, and client-side processing.
End-to-end latency monitoring offers a comprehensive picture of system performance. It facilitates the discovery of latency issues at various application stack tiers. Understanding delays in the request processing pipeline will help you identify problem areas. It will also enhance system performance.
Set Baselines
Baselines are the typical or anticipated latency metrics seen in ordinary operational environments. Gather information on latency measurements over time in common usage scenarios. Use this information to create baselines.
Find the average, median, and percentile values for response time, processing time, network latency, and other latency indicators.
Baselines offer a point of comparison for assessing system performance. They confirm that observed latency levels fall within anticipated bounds. Setting baselines allows you to spot departures from typical behavior. It helps you look into possible performance problems.
Establish Acceptable Performance Thresholds

Credits: Freepik
Latency measurements can use thresholds without causing a decline in performance. Determine threshold values by considering business priorities. Also, consider service level agreements (SLAs) and user experience needs. In measurements, you can express thresholds as absolute numbers. You can also express them as the percentage increases from baseline.
Latency indicators that surpass acceptable bounds trigger thresholds. Thresholds alert administrators or automated systems. By setting thresholds, you can track for performance degradation. You can take corrective action before users experience negative effects.
Apply Historical Analysis
As part of analyzing historical latency data, we examine past performance measurements. The goal is to spot trends, patterns, and persistent problems over time. You can learn more about latency measures by examining historical data. This will help you understand how latency measures behave over different periods and settings.
Examining past data can give you important information about long-term performance patterns. It can also show how latency changes in certain scenarios. You can foresee possible performance difficulties. You can optimize system performance by seeing trends and reoccurring problems. Taking proactive steps is the key.
Link Latency to Additional Measures
You can find likely sources of latency issues by comparing latency measures with other system metrics. For example, CPU, RAM, and network traffic. Consider correlations between different indicators to understand performance bottlenecks and their causes better.
Multidimensional analysis helps you identify the variables affecting performance. You can understand how these variables affect performance by examining the correlations between latency and other system parameters. For instance, higher delay can result from excessive CPU usage or network congestion. You can address underlying problems. You can focus on optimization efforts by correlating metrics.
Execute Dispersed Tracing
Implement distributed tracing techniques to understand end-to-end latency. Use this to find performance bottlenecks across many services or microservices. With distributed tracing, you can follow requests through different system components. This gives you insight into latency at every stage of the request lifecycle.
With distributed tracing, you can identify latency hotspots. You can also comprehend how requests move via a distributed system. Tracing requests across different services or microservices helps you find dependencies between components. You can also identify latency hotspots and performance bottlenecks. This lets you boost system performance, optimize resource allocation, and optimize system design.
Enhance Efficiency
Maximize system performance by using latency monitoring insights. Locate and resolve performance bottlenecks. This can involve increasing resources. It can also involve fine-tuning infrastructure settings. It can involve optimizing code to meet performance expectations.
You can optimize your system based on insights from latency monitoring. This will boost user experience and system performance.
We can identify and address performance bottlenecks through monitoring and analysis. This will help us reduce latency. It will enhance reaction times and ensure optimal resource use. Examples of optimization attempts include code optimizations and caching techniques.
Additionally, there are database, network, and infrastructure optimizations.
Real-World Examples of Latency Issues

Credits: Freepik
E-commerce Website
During major shopping holidays like Cyber Monday and Black Friday, a well-known e-commerce website experiences more delays. User traffic overloads the servers, delaying page loads, product searches, and checkout procedures. As a result, consumers may experience timeouts or sluggish response times when attempting transactions. They may also encounter problems. This can be frustrating and result in lost sales.
Online Gaming Platform
During games, latency problems on a multiplayer online gaming platform can impact how players engage and behave. High latency, sometimes called “lag,” can make games feel unresponsive and sluggish. It delays player input responses. This may cause players to become dissatisfied, less competitive, and lose interest in and loyalty to the game.
Financial Trading System
Fluctuating markets cause latency spikes. These affect trade execution speed and precision in high-frequency trading systems. Traders and companies can incur financial losses from small delays in receiving and processing market data. This can lead to lost trading opportunities or incorrect transactions. Milliseconds count in a competitive trading market. Optimizing latency is essential to keeping a competitive edge.
Telecommunication Network
A telecommunication network experiences latency problems when providing real-time audio or video communication services. This includes VoIP and video conferencing. Long latency can deteriorate user experience and communication quality. It can cause audio or video lag, disruptions, and synchronization problems.
Conclusion
In the current digital environment, efficient latency monitoring is critical. It preserves peak performance and user happiness. Businesses can find and fix performance bottlenecks. They can guarantee prompt response times. They can also provide a flawless customer experience by monitoring latency data.
At RedSwitches, we know latency monitoring is crucial. It’s key to our client’s success in the fast-paced internet services industry.
Our extensive monitoring tools and high-speed, dedicated server solutions enable businesses to control latency issues. They can also optimize system performance and maintain a competitive edge. You can rely on RedSwitches for dependable infrastructure and knowledgeable help. This allows you to offer your users outstanding performance and dependability.
FAQs
Q. How can I measure latency?
Latency may be calculated by timing how long a system or network takes to react to a request or finish a task.
Q. What is a good latency?
A good latency is a low latency. This usually means that system performance is delayed less and response times are quick.
Q. What is an example of latency?
The delay that occurs when a webpage loads or when video content streams due to network traffic or server processing delays is an example of latency.
Q. What is network latency monitoring, and why is it important?
Network latency monitoring measures the time data travels from one point to another within a network. It is important because it helps identify and address potential issues impacting network performance and user experience.
Q. How can I improve network response time?
To improve network response time, you can use tools like latency monitoring software to identify the source of latency and take necessary actions such as reducing network latency and optimizing network paths.
Q. What is a network latency test tool, and how does it work?
A network latency test tool is a software or system used to measure and analyze network latency. It works by sending packets of data and recording the time it takes for them to reach their destination, thus providing insights into the network’s performance.
Q. How can I enable latency monitoring on my network?
You can enable latency monitoring by using specific commands or tools designed for this purpose. These tools continuously monitor network latency and provide real-time data for analysis and troubleshooting.
Q. What is the significance of latency threshold in network performance?
Latency threshold refers to the maximum acceptable latency level within a network. Monitoring and maintaining latency below this threshold ensures optimal network performance and user satisfaction.
Q. What are some common causes of network latency?
Network latency can be caused by various factors such as network congestion, packet loss, inefficient routing, hardware limitations, and issues related to WAN (Wide Area Network) connectivity.
Q. How can I identify the source of network latency issues?
You can identify the source of network latency issues using tools like traceroute, monitoring software, and network latency monitoring tools. These tools help measure and analyze network latency to pinpoint the specific areas or devices causing latency problems.
Q. What are the best practices to reduce network latency?
To reduce network latency, it’s important to optimize network paths, monitor the latency using dedicated tools, troubleshoot possible latency issues, and implement measures to improve network speed and efficiency.
Q. How can I measure and monitor network latency in real time?
You can measure and monitor network latency in real-time by using specialized monitoring tools that continuously check and report the latency levels across the network. These tools provide valuable insights into latency variations and enable proactive monitoring and management.
Q. Why is it essential to document and analyze latency spikes?
Documenting and analyzing latency spikes is essential to understand the events leading to network performance discrepancies. This information can help identify patterns and potential issues and take necessary actions to maintain consistent and reliable network latency.
Q. What is a Latency Command?
A latency command is a computational function frequently used in system performance research and networking to determine how long it takes to respond to a request. It aids in evaluating the responsiveness and efficiency of networks or systems.