
Understanding network performance is crucial for ensuring efficient use and management of the network infrastructure.
Network administrators and users rely on various diagnostic tools to pinpoint potential issues in network operations. One such tool, traceroute (or tracert on Windows), plays a vital role in visualizing the path packets travel from source to destination.
In this comprehensive tutorial, we will look into the functionality of traceroute. We will see how you can apply the utility to run traceroute commands on Linux, Windows, and macOS platforms.
Let’s start with an overview of the traceroute utility.
Table Of Contents
- What is traceroute?
- How Does traceroute Work?
- How to Run a Traceroute
- How to Read the Traceroute Results?
- Saving the Output for Later Analysis
- Conclusion
- FAQs
What is traceroute?
traceroute, also known as tracert in Windows, is a vital network diagnostic tool. Network admins use the traceroute command during network troubleshooting to map out the paths of data packets across the network.
The tool helps identify possible information routes from a source to a destination. By analyzing this route, the traceroute helps identify potential bottlenecks or problem areas that might be causing slow connections or connection failures.
In addition, it also determines the transmission times across network nodes. Admins also use traceroute to identify the locations of traffic slowdowns between a source and a destination when troubleshooting a network.
How Does traceroute Work?
traceroute operates by sending ICMP (Internet Control Message Protocol) packets from the source to the destination, with each router along the path generating a response. The output of a traceroute command typically includes:
- The router’s IP address where the packet was successfully received.
- The round-trip time, representing the travel latency. It is the time taken to receive a response for each probe.
- The number of hops (routers) between the source and the destination.
In basic terms, a traceroute is a sequence of pings. The utility collects the intermediate data in addition to pinging the target to request a response.
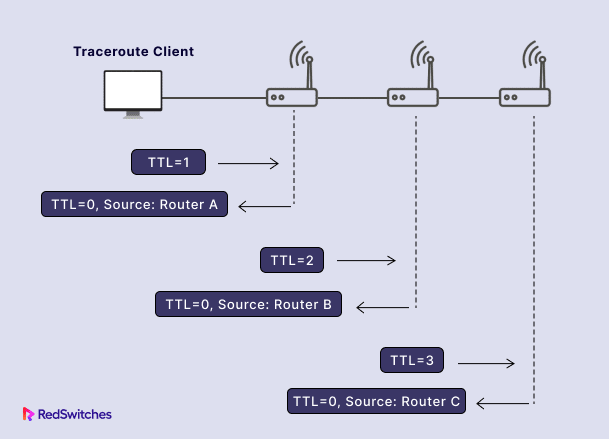
The process continues until the final packet arrives at the destination IP. Once the destination IP has been determined, traceroute outputs all the intermediate data it has gathered. The command automatically sends out three probes for every TTL value and outputs the round-trip time for each packet.
The Prerequisites
Before working with traceroute, make sure you have the following:
- Access to a terminal or the command line.
- A stable network connection.
- An IP address or website to track
How to Run a Traceroute
Most modern operating systems support traceroute. The application is a command-line utility that has a similar syntax and settings, with minor changes across the operating system.
As a result, while the specific syntax (command format) for running traceroute might differ slightly among operating systems, its core functionality remains the same: identifying the path packets take to reach a target destination.
The traceroute’s default size for an IPv4 packet is typically 60 bytes, and an IPv6 packet is usually 80 bytes, with 30 hops.
Use a Linux Traceroute
On most Linux distributions, including Ubuntu, the traceroute command might not be preinstalled. So, the first step is to install the utility with the apt package manager by executing these steps.
- Open the terminal by pressing CTRL+ALT+T and install the traceroute using the following command:
# sudo apt install traceroute
- Once installed, type traceroute into the terminal, followed by the desired options and the hostname or IP address:
# traceroute [options] <hostname or IP> [packet length]
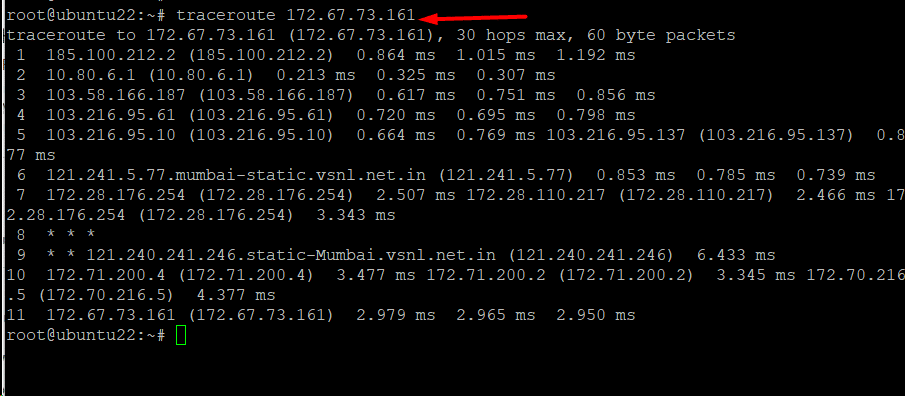
For instance, consider the following command that traces the route to the specified IP address:
# traceroute 172.67.73.161
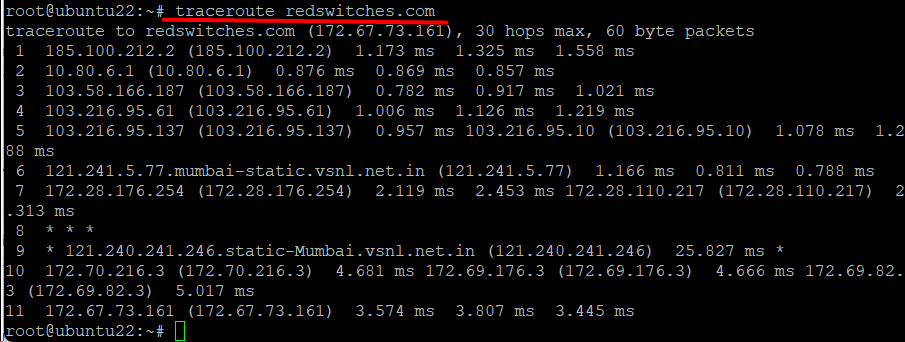
As an alternative, you can use a hostname for the traceroute command:
# traceroute redswitches.com
Advanced Linux Traceroute Options
By default, traceroute sends UDP packets and sends three probes per hop. To use ICMP probe packets instead of UDP, use -I option in the following command format:
# traceroute -I <hostname or IP>
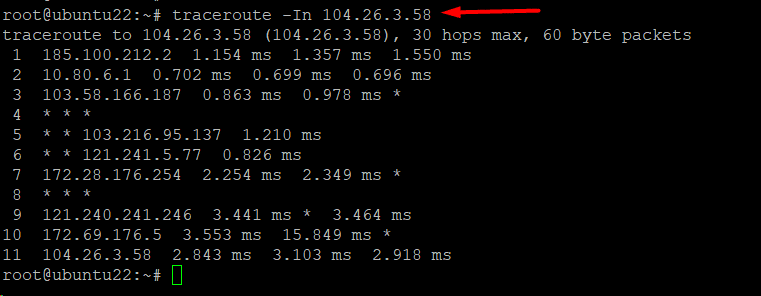
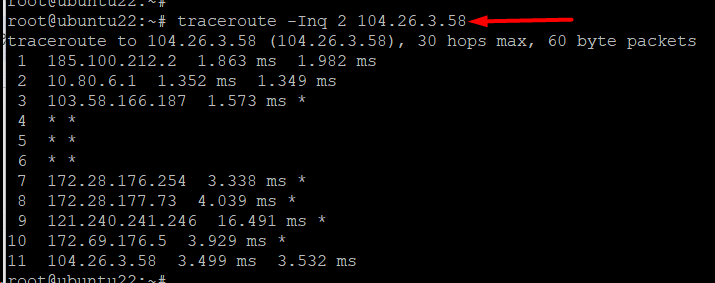
We recommend the -n option for a more visually appealing and cleaner output without the device name:
# traceroute -In <hostname or IP>
By default, the traceroute sends out three packets. However, you can use the -q option to adjust the number of packets sent per hop:
# traceroute -Inq <number> <hostname or IP>
By reducing the number of packets in a traceroute request, you increase the speed of the traceroute but may lose reliable data due to potential network variations.
We recommend the man command to view the manual pages in the terminal to view all command parameters.
# man traceroute
Run a Windows Traceroute
Traceroute, also called tracers, is also available to Windows users.
Follow these steps to run a traceroute on Windows:
- Press the Windows key and type CMD in the run box.
- Press Enter to access the Command Prompt.
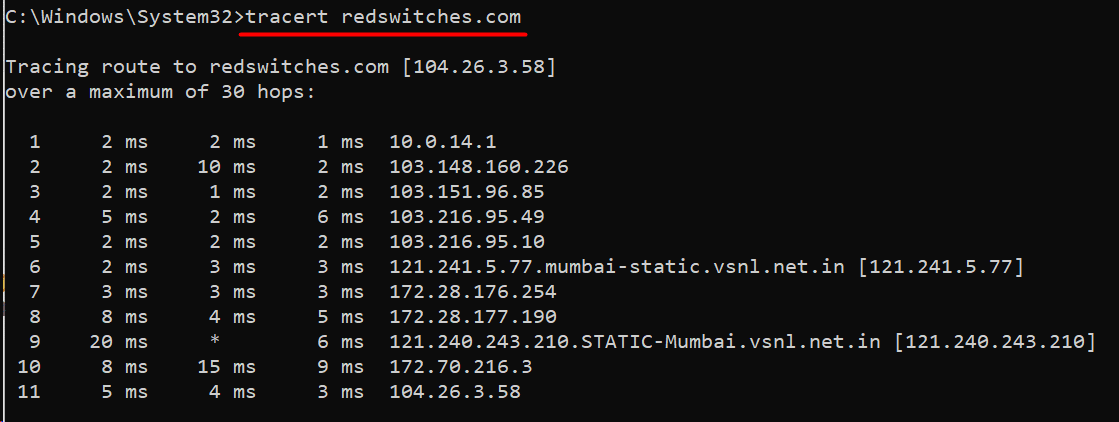
- Enter the following command and run traceroute:
tracert [options] <hostname or IP>
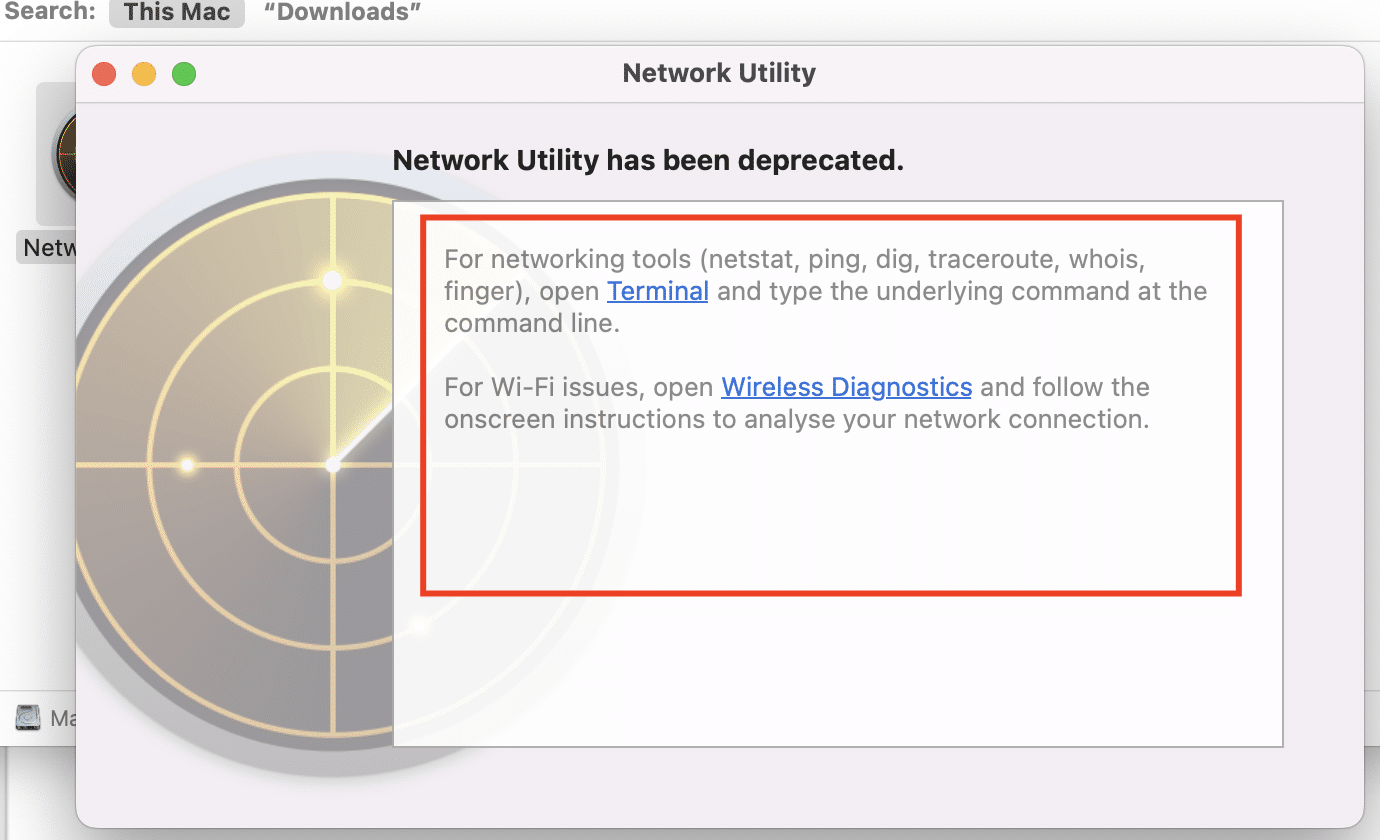
Use a macOS Traceroute
Use the following steps to run a traceroute on macOS:
- Select the magnifying glass-shaped Spotlight icon.
- Next, use the search area to look up Network Utility.
- Double-click the Network Utility that appears in the search result.
- In the Network Utility window, navigate to the Traceroute tab.
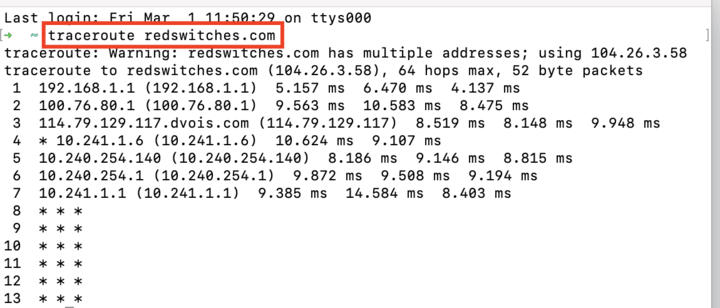
- Enter the hostname or IP address you want to trace into the Enter the network address to trace field.
$ traceroute [options] <hostname or IP>
- Click the Trace button to initiate the traceroute process.
How to Read the Traceroute Results?
The output of a traceroute command displays critical information about the path packets take to get to their destination. The output is typically divided into three general columns:
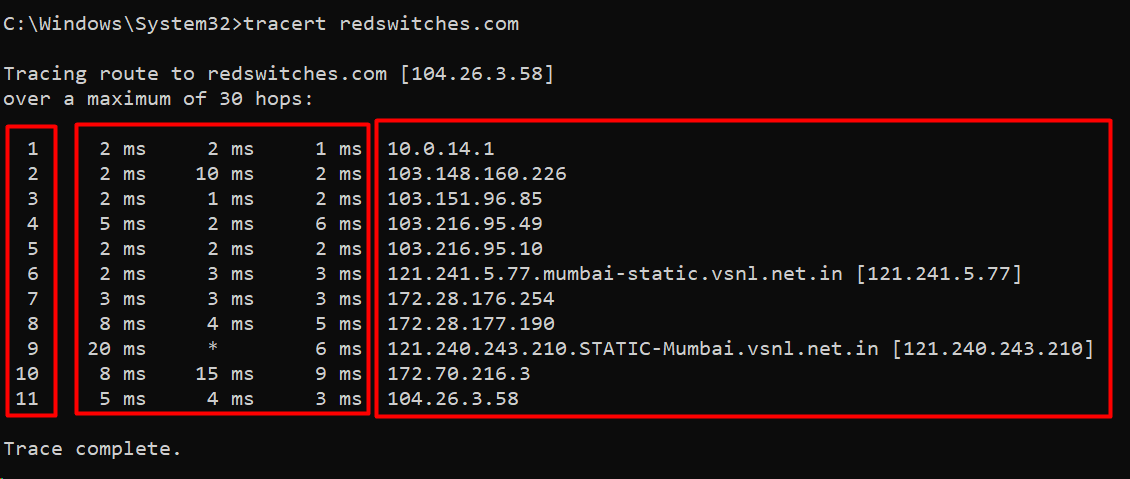
- The first column indicates the order of routers encountered. Each line indicates the router’s hop.
2. The following three columns display round-trip time (RTT) for three packets
- These values are typically less than 100 ms for close networks.
- Typical RTT values for distant networks in other countries can go up to 300m.
- When three icons (* * *) appear in place of numbers, and a Request timed out message shows up, it can mean:
3. There is a router failure.
4. The router is set up not to provide traceroute information.
5. The router is configured with a firewall.
6. An expired session for one of the earlier routers.
7. The last column displays the resolved domain name and, if available, the destination IP address.
Interpreting the Route
The traceroute output rows are divided into five parts:
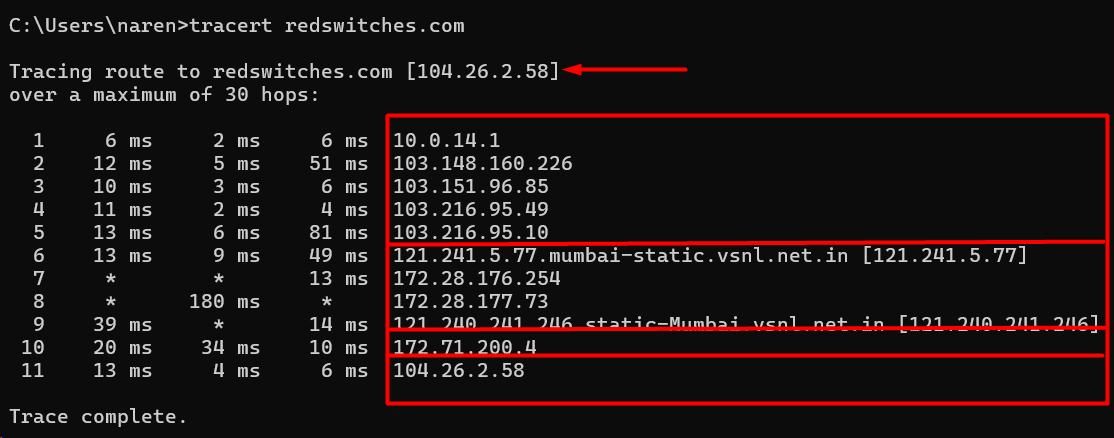
- The Local network.
- The local network’s internet service provider (ISP).
- The online world.
- The host network at the destination.
- The Destination address.
Saving the Output for Later Analysis
You can save the output of a traceroute command by redirecting it to local file.
Add > and the name of a text file to the end of a traceroute or tracert command to save the output into the text file for later analysis.
For instance, run the following command in Linux and macOS:
# traceroute 8.8.8.8 > results.txt
Windows users can run a similar command:
> tracert 8.8.8.8 > result.txt
In all these cases, you will not see anything in the terminal. Instead, the output is saved in the text file.
Conclusion
Knowing how to perform a traceroute on Windows, Linux, and macOS offers important insights into comprehending data’s route over a network. This tutorial has demonstrated the exact procedure for running traceroute commands on several operating systems, enabling users to locate and resolve connectivity problems easily. Traceroute is a useful tool for network diagnostics that may be used to identify routing inefficiencies, packet loss, and latency. Through proficiency with traceroute on multiple platforms, users can improve network efficiency, resolve problems, and guarantee a smooth and optimized data transfer process.
If you’re looking for a robust server for your projects, we offer the best dedicated server pricing and deliver instant dedicated servers, usually on the same day the order gets approved. Whether you need a dedicated server, a traffic-friendly 10Gbps dedicated server, or a powerful bare metal server, we are your trusted hosting partner.
FAQs
Q. Why would I use traceroute on my system?
Traceroute is a valuable diagnostic tool used to identify and troubleshoot network connectivity issues by tracing the route data takes from your system to a destination.
Q. Can I use any operating system to execute traceroute?
Yes, traceroute commands are available on various operating systems, including Linux, Windows, and macOS, providing a cross-platform solution for network diagnostics.
Q. How do I interpret the output of a traceroute command?
The output displays a list of routers (hops) along the data path, indicating latency times for each hop. High latency or timeouts may indicate network issues.
Q. Are there differences in the traceroute command syntax across operating systems?
While the core functionality is similar, the command syntax can vary. Refer to the specific traceroute command options for Linux, Windows, or macOS.
Q. Can traceroute identify specific network issues?
Traceroute can help identify issues like packet loss, network congestion, or routing inefficiencies by revealing each hop’s latency and response times.
Q. Is there a recommended time to run the traceroute for more accurate results?
Running a traceroute during periods of network issues or when experiencing connectivity problems can provide more accurate and relevant results.
Q. How do I know if a high latency value in traceroute is a concern?
While some latency is expected, significant and consistent increases in latency values may indicate potential network problems that require further investigation.
Q. Can I use traceroute to troubleshoot connectivity to a specific website or IP address?
You can use the traceroute command followed by the website’s domain name or IP address to trace the route and identify potential connectivity issues.
Q. Are there graphical tools available for running traceroute?
Some operating systems and third-party applications provide graphical interfaces for traceroute, offering a more user-friendly experience.
Q. Can a traceroute be used to verify the effectiveness of changes made to the network configuration?
Yes, running traceroute before and after network changes can help verify the impact of the changes on data paths and identify any unexpected routing issues.