Key Takeaways
- Kubernetes Monitoring Involves tracking resources, health, scaling, logs, and security to ensure optimal cluster operation.
- It Helps optimize resources, ensure availability, troubleshoot effectively, scale appropriately, meet SLAs, and maintain security.
- For comprehensive insights, focus on node, pod, container, API server, and Kubelet metrics.
- Kubernetes Changes Monitoring Dynamic nature, service discovery, granular container visibility, and auto-scaling require adaptable monitoring tools.
- Top Tools of Kubernetes Dashboard, Prometheus, Jaeger, Elastic Stack, and Kubewatch provide monitoring and alerting capabilities.
- Challenges include the Complexity of microservices, scalability concerns, dynamic container changes, resource overheads, and security risks.
- Collecting diverse metrics, implementing robust alerting, centralizing log management, and enabling distributed tracing are best practices.
- Kubernetes Monitoring is Essential to Ensure proactive management and optimization of containerized environments.
Exploring the world of Kubernetes is like being a space explorer. You need more than just technical know-how. You must be like a space watcher, always alert. In the vast space of managing containers, every pod is like a star, alive with digital activity. Welcome to our journey into Kubernetes monitoring. Every change in your cluster’s activity can mean good health or a sign of trouble ahead.
Think of Prometheus not as the ancient god from myths but as a modern guardian. It watches over your digital world. As we move through the space of monitoring tools, think of Prometheus as our guide. It helps us find the best ways to keep our Kubernetes deployment running smoothly. We’ll take a close look at how to monitor Kubernetes with Prometheus.
Let’s dive into the world of Kubernetes monitoring together. We’ll uncover the secrets to keeping your clusters in perfect balance.
Table Of Contents
- Key Takeaways
- What is Kubernetes Monitoring?
- Why is Kubernetes monitoring important?
- What Kubernetes Metrics Should You Measure?
- What can Kubernetes do?
- Kubernetes Monitoring: How Kubernetes changes your monitoring strategy
- Why is Kubernetes monitoring so complex?
- Configuring labels in Kubernetes
- Top 5 Kubernetes Monitoring Tools
- Kubernetes Monitoring Challenges
- 4 Kubernetes Monitoring Best Practices
- Conclusion
- FAQs
What is Kubernetes Monitoring?

Credits: Freepik
One type of reporting that aids with cluster management proactively is Kubernetes monitoring. Monitoring a Kubernetes cluster, which keeps track of memory, CPU, and storage utilization, makes managing containerized infrastructure easier.
When the required number of pods is not running, resource utilization is getting close to critical limits, or errors or misconfiguration prevent pods or nodes from participating in the cluster, cluster operators may keep an eye on things and get notifications.
Programs like Prometheus, Grafana, Datadog, and others are frequently utilized for Kubernetes monitoring. These tools allow administrators to gather, view, and evaluate metrics, logs, and other pertinent data, giving them the knowledge they need to keep their Kubernetes infrastructure operating smoothly.
Reliable, scalable, and secure containerized systems depend on efficient Kubernetes monitoring in a constantly evolving environment.
Key Aspects of Kubernetes Monitoring
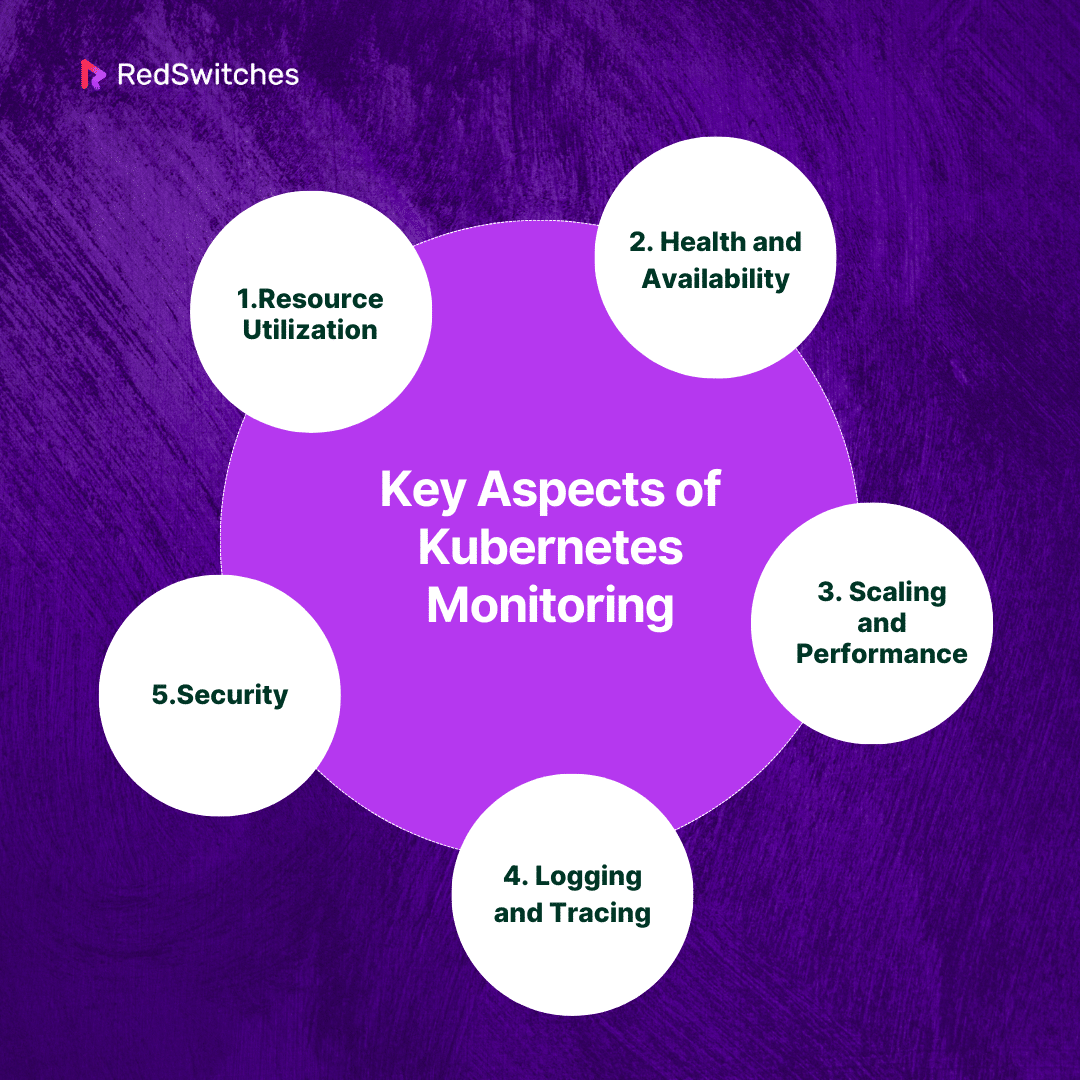
Now, let’s go into the key aspects of Kubernetes Monitoring.
Resource Utilization
Carefully tracking resource use is essential to monitoring a Kubernetes cluster’s health. This includes monitoring CPU utilization to ensure processing power is effectively allocated amongst pods and nodes.
Memory monitoring simultaneously ensures that programs don’t have memory leaks or wasteful use. Storage metrics are essential to avoid bottlenecks and ensure that the allotted storage capacity corresponds with operational demands.
Health and Availability
You need to pay equal attention to pod health and service health to maintain the health of your Kubernetes environment. Thorough pod health monitoring confirms their operational status, identifying problems and guaranteeing smooth operation.
Service availability checks, which depend on strong health checks to effectively manage traffic, ensure that applications remain available to end users.
Scaling and Performance
Examining auto-scaling metrics, assessing the efficacy of scaling policies, and optimizing configurations for maximum performance are all necessary steps in navigating the dynamic scaling terrain. Metrics unique to an application become critical as it moves beyond infrastructure. Administrators are guided in maintaining a well-tuned, high-performance system by insights on response times, throughput, and overall application performance.
Logging and Tracing
Careful log analysis tells the story of a Kubernetes cluster. Pods and nodes provide logs that act as a breadcrumb trail for troubleshooting and interpreting the behavior of applications. The skill of tracing, which enables administrators to track requests as they move through different services, enhances this story by helping to spot bottlenecks and improve performance.
Security
Monitoring security events and logs is a continuous task in securing the Kubernetes domain. Careful observation reveals attempted illegal access, possible vulnerabilities, and other security events. Vulnerability scanning goes beyond events to guard against any dangers, ensuring that only secure container images can reside in the cluster.
Also read What Is Cluster in Cloud Computing & How It’s Revolutionizing Business Scalability and Performance
Why is Kubernetes monitoring important?
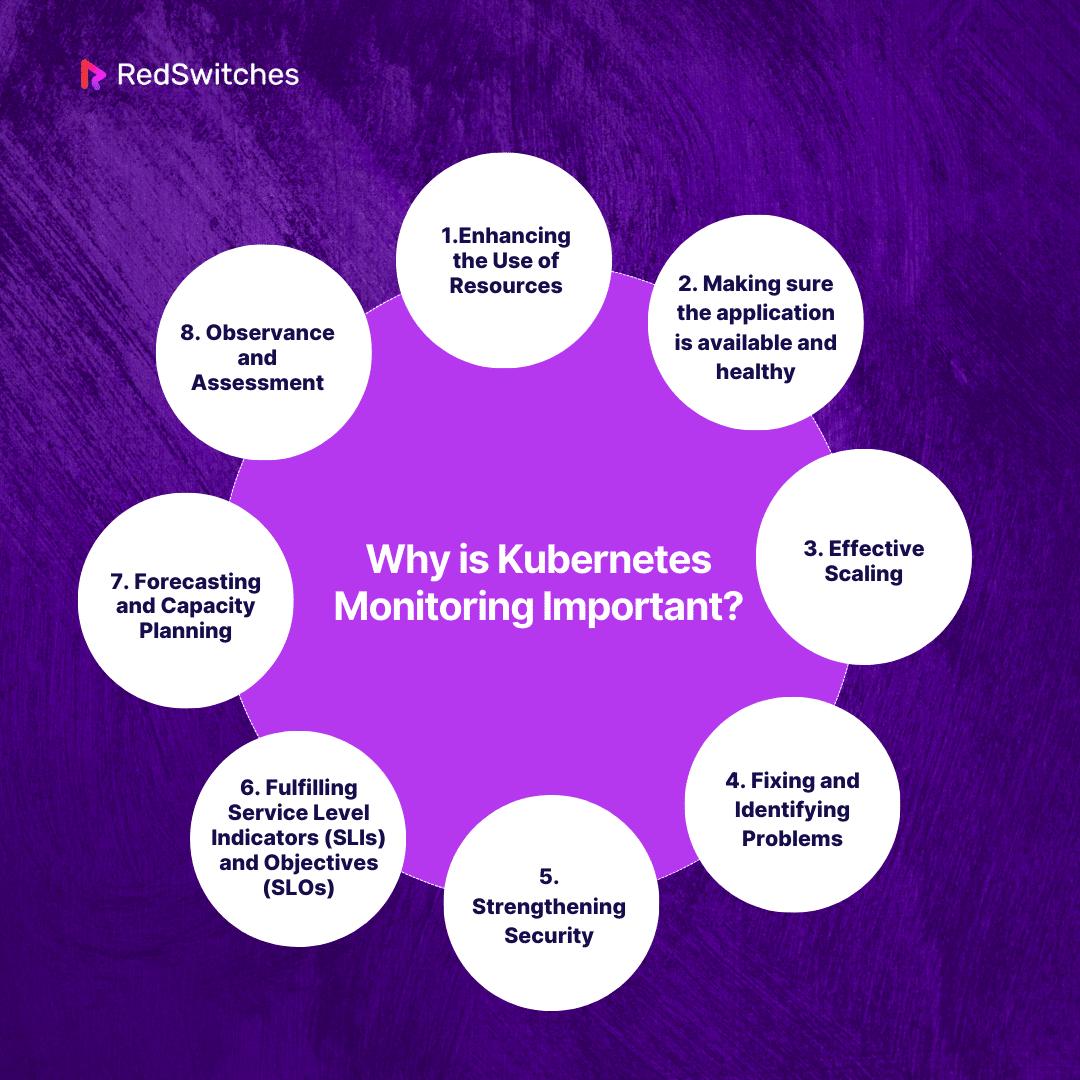
So why is Kubernetes monitoring so important? In this section, we will focus on the reasons for this.
Enhancing the Use of Resources
Monitoring makes it easier to track how much CPU, memory, and storage are used by the cluster, pods, and nodes. This information is essential to avoid bottlenecks, optimize resource allocation, and ensure that applications have the resources they require to run well.
Making sure the application is available and healthy
Monitoring enables real-time observation of the health and availability of applications and services. It guarantees that end users can still access applications and saves downtime by assisting in identifying problems such as pod failures or service disruptions.
Effective Scaling
Kubernetes makes automatic scaling in response to demand possible; nonetheless, efficient scaling necessitates knowledge of the cluster’s performance. Thanks to the metrics they monitor on auto-scaling and application performance, administrators can ensure optimal performance during shifting workloads by making informed decisions about resource scaling.
Fixing and Identifying Problems
Traces, metrics, and logs gathered by monitoring technologies offer helpful information for problem-solving and diagnosis. Administrators can use this data to troubleshoot issues, find the source of problems, and quickly apply fixes.
Strengthening Security
Keeping a secure Kubernetes system requires regular monitoring. Administrators can quickly identify and address possible security issues by monitoring security events, unauthorized access attempts, and vulnerabilities. Protecting sensitive data and preventing unwanted access require this proactive approach.
Fulfilling Service Level Indicators (SLIs) and Objectives (SLOs)
Monitoring assists organizations in meeting their SLOs by revealing the performance parameters that matter most to users. Like error rates or reaction times, SLIs can be tracked and controlled to ensure Kubernetes services fulfill predetermined performance requirements.
Forecasting and Capacity Planning
Data monitoring is essential for capacity planning because it enables administrators to see patterns in resource use today and predict future needs. By taking a proactive stance, companies may expand their infrastructure ahead of increasing demands and avoid performance deterioration.
Observance and Assessment
Monitoring helps ensure compliance in sectors with particular regulatory requirements by keeping track of and recording system actions. Audit logs and data monitoring may be important to prove adherence to security and data protection regulations.
What Kubernetes Metrics Should You Measure?

Measuring a range of metrics is essential while monitoring a Kubernetes cluster to obtain insights into performance, health, and resource usage. The following are important Kubernetes metrics that you ought to think about monitoring:
Node Metrics
Observing node metrics is essential to comprehending the functionality and state of the underlying infrastructure. CPU use gives managers information about each node’s processing capability, enabling them to allocate resources as efficiently as possible. Memory consumption measurements ensure enough memory is available for programs to run smoothly.
Monitoring network utilization can detect possible bottlenecks or network-related problems that could impede node-to-node communication. By monitoring each node’s storage use, filesystem utilization metrics ensure that nodes have enough space for logs and application data.
Pod Metrics
These metrics provide a thorough picture of each workload in the cluster at the pod level. Administrators can detect resource-intensive apps and optimize resource allocation by monitoring CPU and memory utilization per pod. Each pod’s network consumption measurements offer information about communication trends, which helps with network configuration optimization and troubleshooting. Filesystem metrics guarantee that every pod has enough storage capacity, preventing problems caused by storage limitations and promoting efficient operation.
Container Metrics
Metrics at the container level enable granularity within pods and provide information about how well individual containers are performing. Resource optimization can be aided by administrators detecting resource-intensive containers within pods by looking at CPU and memory utilization at the container level.
At this level, filesystem utilization data help with capacity planning and storage management by revealing the storage habits of individual containers.
Metrics for Kubernetes API Servers
Metrics on the Kubernetes API server are essential to evaluating its responsiveness and dependability. Request latency metrics track how long API servers take to respond to client requests to guarantee prompt responses. Error rates give admins valuable information about possible problems that could compromise the API server’s dependability, enabling them to detect and resolve difficulties quickly.
Also read GraphQL vs REST: Which API is Best for Your Application?
Kubelet Metrics
These metrics inform how well individual nodes perform and interact with containers. Container runtime metrics give insight into container lifecycles by providing information on container start and restart counts. Pod metrics facilitate effective resource management by giving administrators insight into how the kubelet handles pod creation, deletion, and eviction.
What can Kubernetes do?
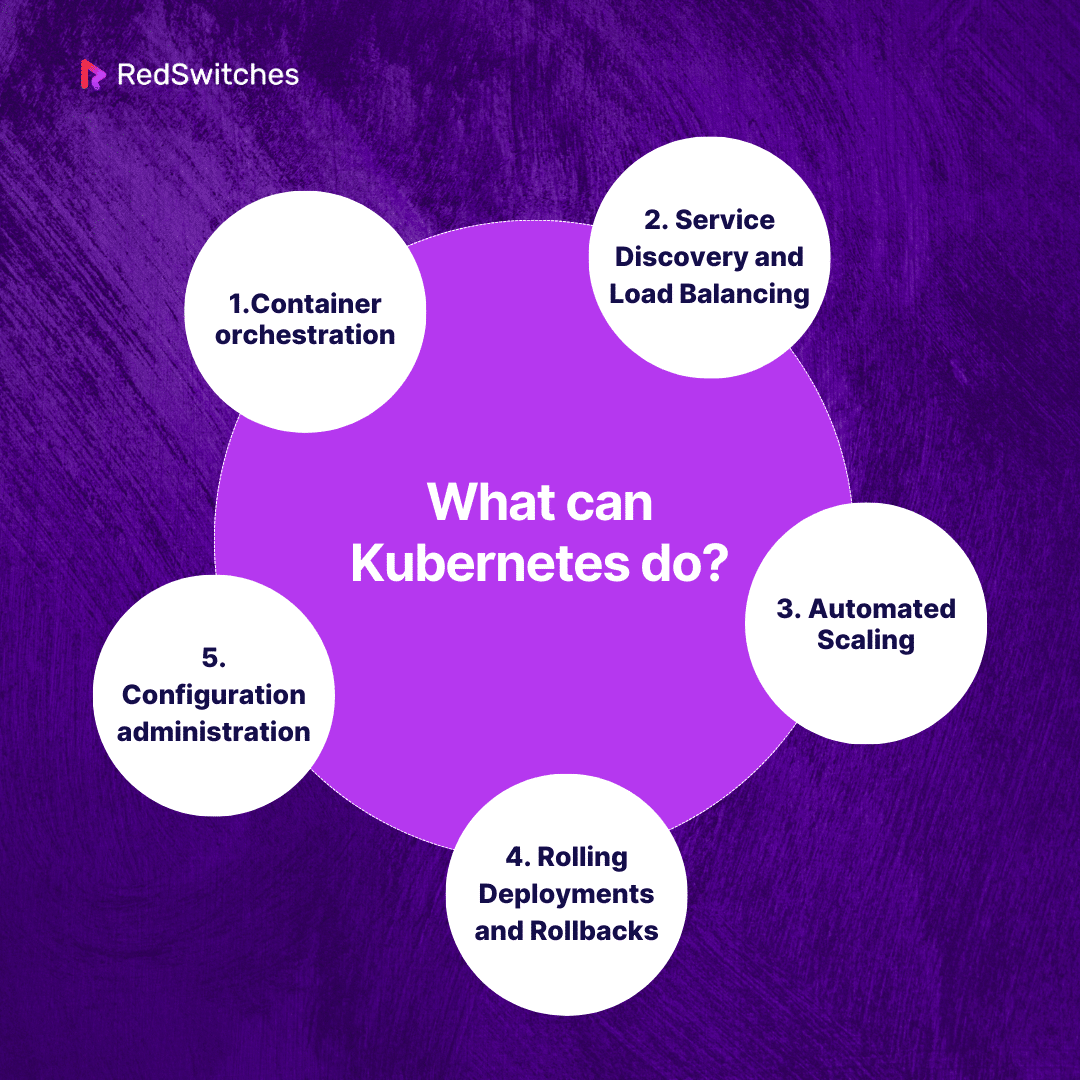
Let’s understand what Kubernetes can do.
Container orchestration: Kubernetes ensures that apps operate consistently in various contexts by automating the deployment and scaling of containers.
Service Discovery and Load Balancing: Thanks to its load balancing and service discovery methods, applications can find and connect more easily.
Automated Scaling: Kubernetes allows apps to scale automatically in response to demand, guaranteeing peak performance and efficient resource use.
Rolling Deployments and Rollbacks: Rolling updates are supported, which makes it possible to gradually roll out new program versions without experiencing any downtime. Rollbacks are easy to do in the event of problems.
Configuration administration: Kubernetes simplifies consistency across many settings by enabling application configuration definition and administration.
Kubernetes Monitoring: How Kubernetes changes your monitoring strategy
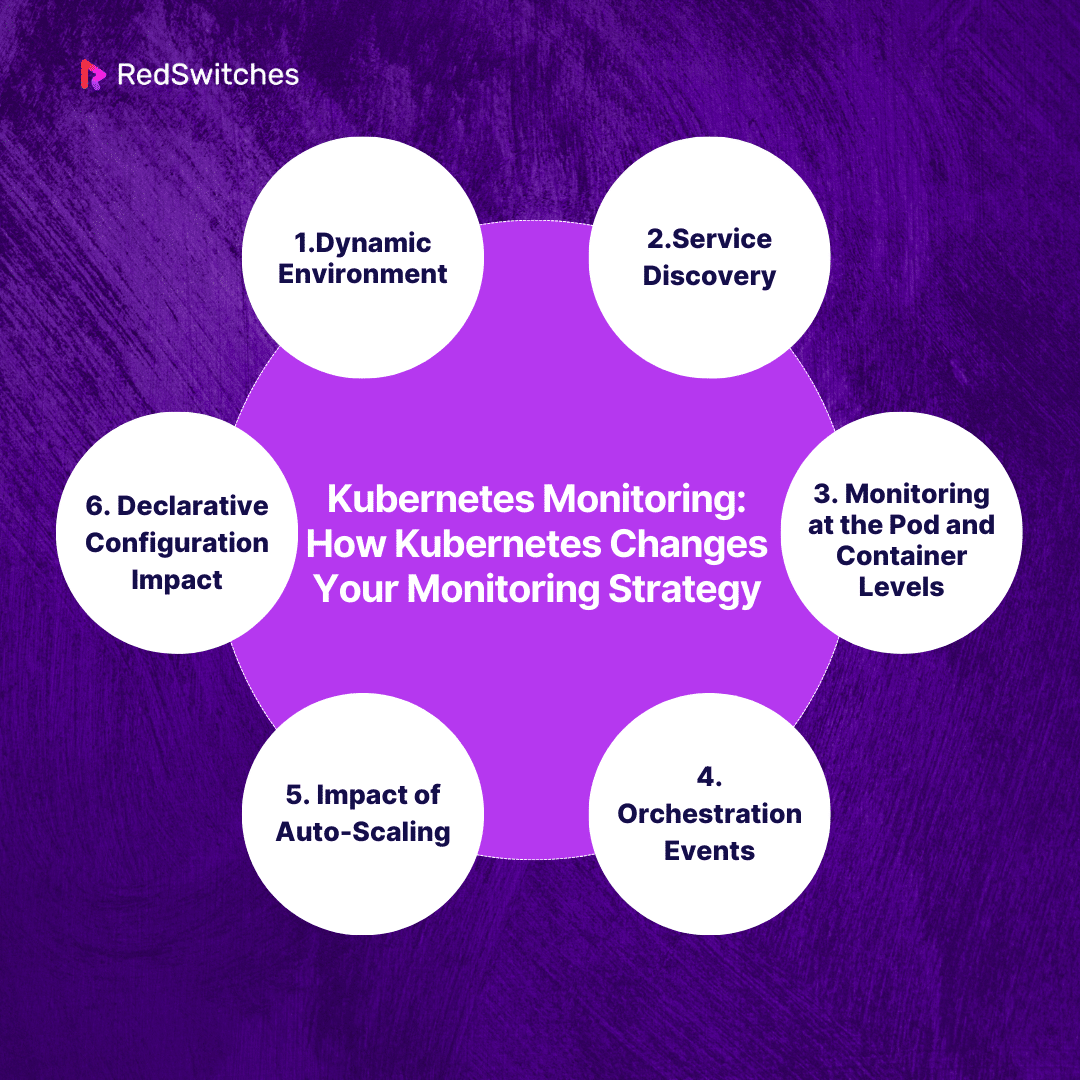
Kubernetes introduces new complications and opportunities in a containerized, dynamic environment, fundamentally altering monitoring tactics. In a nutshell, Kubernetes modifies your monitoring approach by:
Dynamic Environment
Kubernetes modifies the conventional static infrastructure perspective by coordinating dynamic, transient containers. The dynamic nature of pods that scale up or down in response to demand requires monitoring to adjust.
Service Discovery
Monitoring techniques utilizing dynamic service discovery must dynamically identify and track services as they are launched or terminated to provide reliable metrics gathering and health monitoring.
Monitoring at the Pod and Container Levels
Pod and container-level metrics are tracked instead of the more general server-level metrics. A more thorough methodology is needed to comprehend and optimize resource utilization at the microservices level.
Orchestration Events
Monitoring Kubernetes events like pod formation, scaling, and termination is crucial. Monitoring real-time orchestration events is crucial for troubleshooting and resource allocation optimization.
Impact of Auto-Scaling
Kubernetes’ auto-scaling features require monitoring tools that can adjust to the applications’ dynamic scaling. Auto-scaling metrics—like replica counts and scaling events—become essential for efficient oversight.
Declarative Configuration Impact
Instead of concentrating on the individual server states, monitoring tactics should align with Kubernetes’ declarative configuration approach, focusing on intended states and configurations.
Why is Kubernetes monitoring so complex?

Credits: Freepik
Using Kubernetes, businesses may run software applications on more powerful computers. In private, cloud, or hybrid environments, it automates the deployment, scheduling, and management of application containers on clusters of servers, frequently numbering in the hundreds of thousands or more.
Additionally, by integrating container images with a continuous integration/deployment (CI/CD) system or deploying them on Kubernetes, developers can establish a “container-centric” environment.
K8s is a platform that does not restrict the kinds of supported applications or services and may be coupled with other technologies for additional functionality. Kubernetes is used by several container-based Platform-as-a-Service (PaaS) platforms.
Unlike these PaaS systems, K8s isn’t all-inclusive; it doesn’t construct apps, offer middleware, or have a marketplace that can be deployed with a single click. K8s is a more imperative orchestration platform, while other PaaS tends to be more feature-rich and declarative.
Configuring labels in Kubernetes
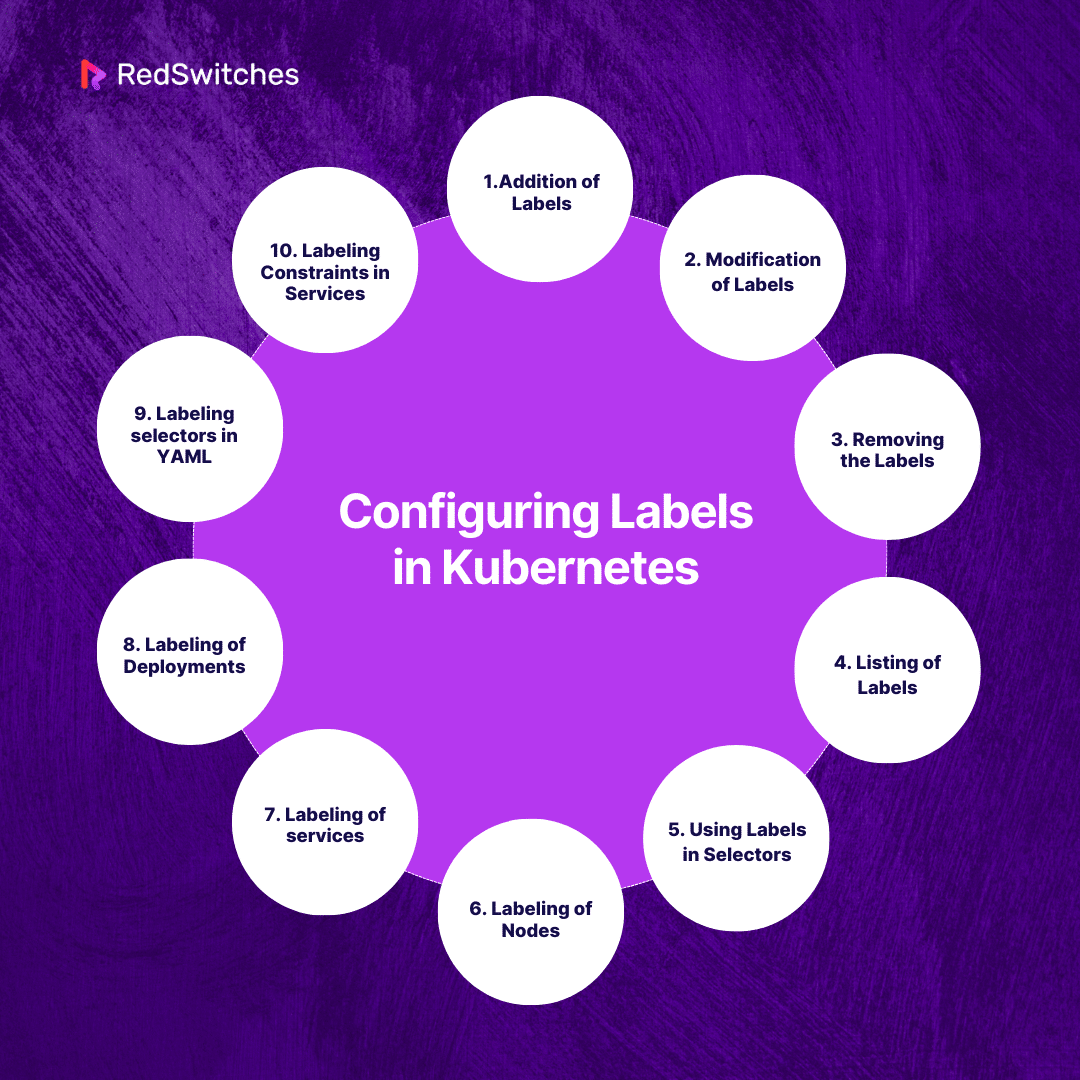
Labels in Kubernetes are key-value pairs that are affixed to nodes, services, and pods. These labels let users arrange and choose resources according to user-defined criteria. Adding, changing, or removing labels for Kubernetes objects is known as label configuration. Here’s a quick tutorial on setting up labels in Kubernetes:
Addition of Labels
The kubectl label command can add labels to a Kubernetes object. As an illustration, to label a pod:
kubectl label pod <pod-name> <label-key>=<label-value>
Modification of Labels
To edit the value of an existing label, you can use the same kubectl label command with the new value. As an illustration:
kubectl label pod <pod-name> <label-key>=<new-label-value> --overwrite
Removing the Labels
To delete a label from a Kubernetes object, you can use the kubectl label command with the label key and a dash (-) as the value. As an illustration:
kubectl label pod <pod-name> <label-key>-
Listing of Labels
You may list the labels associated with a Kubernetes object using the kubectl get command with the –show-labels parameter. As an illustration:
kubectl get pod <pod-name> --show-labels
Using Labels in Selectors
Selectors frequently utilize labels to filter resources. To list every pod that has a particular label, for example:
kubectl get pods -l <label-key>=<label-value>
Labeling of Nodes
Labeling nodes within a Kubernetes cluster is another option. As an illustration:
kubectl label node <node-name> <label-key>=<label-value>
Labeling of services
Like other objects, services can have labels applied to them. As an illustration:
kubectl label service <service-name> <label-key>=<label-value>
Labeling of Deployments
Labels for deployments can be added later on or during the creation process:
kubectl create deployment <deployment-name> --image=<image-name> --labels=<label-key>=<label-value>
Labeling selectors in YAML
Label configuration is also possible using YAML manifests. As an illustration, in a Pod manifest:
apiVersion: v1
kind: Pod
metadat
name: example-pod
labels:
app: example-app
tier: frontend
spec:
containers:
- name: example-container
image: nginx
Labeling Constraints in Services
Services can limit the set of pods by using label selectors:
apiVersion: v1
kind: Service
metadat
name: example-service
spec:
selector:
app: example-app
tier: frontend
ports:
- protocol: TCP
port: 80
targetPort: 8080
Top 5 Kubernetes Monitoring Tools
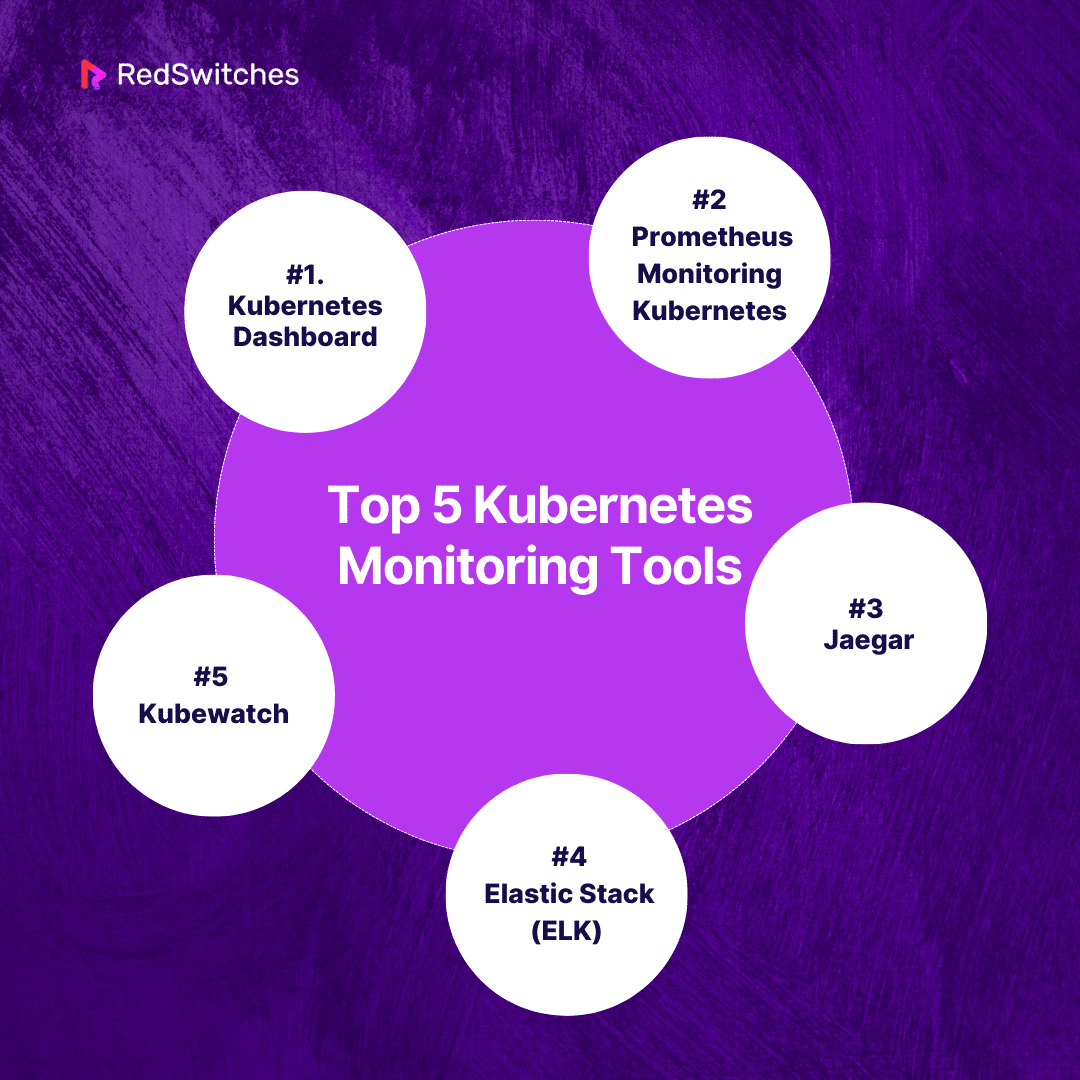
After discussing the configuring labels in Kubernetes monitoring, we will now discuss the core part of our blog i.e. 5 Kubernetes Monitoring Tools, in detail.
Kubernetes Monitoring tool #1 Kubernetes Dashboard
The Kubernetes Dashboard offers a centralized web-based interface for controlling and monitoring your Kubernetes cluster. Typically, the overview section contains vital information, including the cluster’s current status, total resource utilization, and health indicators. This facilitates administrators’ instantaneous assessment of the cluster’s status.
Resource Usage
The resource usage section provides comprehensive CPU, memory, and network utilization metrics for nodes and pods. This data is essential for determining bottlenecks, allocating resources optimally, and guaranteeing that the application running within the cluster runs smoothly.
Also read Network Databases: Cheat Codes You Must Know
Details of Deployment
The dashboard provides information on the quantity, condition, and general health of replicas for deployed applications. This helps with application management and debugging, enabling administrators to respond quickly to concerns and scale up or down applications as necessary.
Logs and Events
Applications operating in the cluster and Kubernetes components produce logs and events accessible through the dashboard. This feature is essential for debugging programs, diagnosing problems, and comprehending the historical background of events inside the cluster.
Kubernetes Monitoring tool #2 Prometheus Monitoring Kubernetes
Here’s a comprehensive guide to understanding Prometheus monitoring in Kubernetes. Covering key concepts:
Data Collection
Prometheus uses a pull-based paradigm to gather metrics from nodes, pods, and services, among other components in the Kubernetes cluster. This allows for close monitoring of the cluster’s overall health, application performance, and resource utilization.
Alerting
Prometheus has a powerful alert system that lets users set up criteria and rules to send out alerts. This guarantees administrators are promptly informed of possible problems or anomalies, enabling proactive problem-solving and management.
Storage
Prometheus effectively stores time-series data, allowing businesses to keep track of past measurements for analysis and auditing needs. The storage system can handle large data sets, which offers a solid basis for ongoing reporting and monitoring.
Kubernetes Monitoring tool #3 Jaegar
Let’s delve into Jaeger as a Kubernetes monitoring tool, focusing on tracing, Dependency Mapping and Root Cause Analysis:
Tracing
Jaeger makes distributed tracing possible, enabling businesses to follow the path taken by requests as they pass via different microservices. This is very helpful for figuring out dependencies, finding performance bottlenecks, and enhancing the general effectiveness of microservices-based applications.
Dependency Mapping
Jaeger creates visual dependency maps showing connections between various components and services. Teams may better grasp their architecture with this visualization, making it simpler to see how modifications to one service may affect others.
Root Cause Analysis
Jaeger supports root cause analysis by providing comprehensive tracing data. Teams can rapidly identify the root cause of errors or performance problems, be it a particular microservice, a network latency issue, or other contributing element.
Kubernetes Monitoring tool #4 Elastic Stack (ELK)
Here’s a breakdown of the Elastic Stack (ELK) for Kubernetes monitoring:
Elasticsearch
Elasticsearch is a strong distributed search and analytics engine. It saves and indexes log data produced by Kubernetes components and applications in the context of Kubernetes monitoring, making effective and quick search capabilities possible.
Logstash
Logstash is a data processing pipeline that gathers, modifies, and enhances log data before forwarding it to Elasticsearch. It supports several input sources, filters, and output destinations, providing flexibility in handling different log formats and sources inside the Kubernetes environment.
Kibana
Kibana is the interface for visualizing and exploring log data kept in Elasticsearch. It lets users create custom dashboards, run ad hoc searches, and visualize log data in graphs and charts. Kibana is a crucial tool for log analysis and monitoring.
Kubernetes Monitoring tool #5 Kubewatch
Let’s dive into Kubewatch, a specialized Kubernetes monitoring tool:
Event Notifications
Kubewatch is an expert in providing in-the-moment event notifications about Kubernetes operations. Alerts can be sent for several events, including updates, deletions, and pod creations. This guarantees that important changes in the cluster are rapidly communicated to developers and administrators.
Customized Notifications
Users can select the channels via which they get notifications and the kinds of notifications they get. Thanks to this flexibility, teams can customize their alerting options according to the importance and urgency of certain occurrences.
Configurability
Kubewatch has a very configurable design. Users can create rules and filters to choose which events they wish to receive notifications about. Because of their configurable nature, alerts are guaranteed to be pertinent and aligned with the organization’s monitoring requirements.
Kubernetes Monitoring Challenges
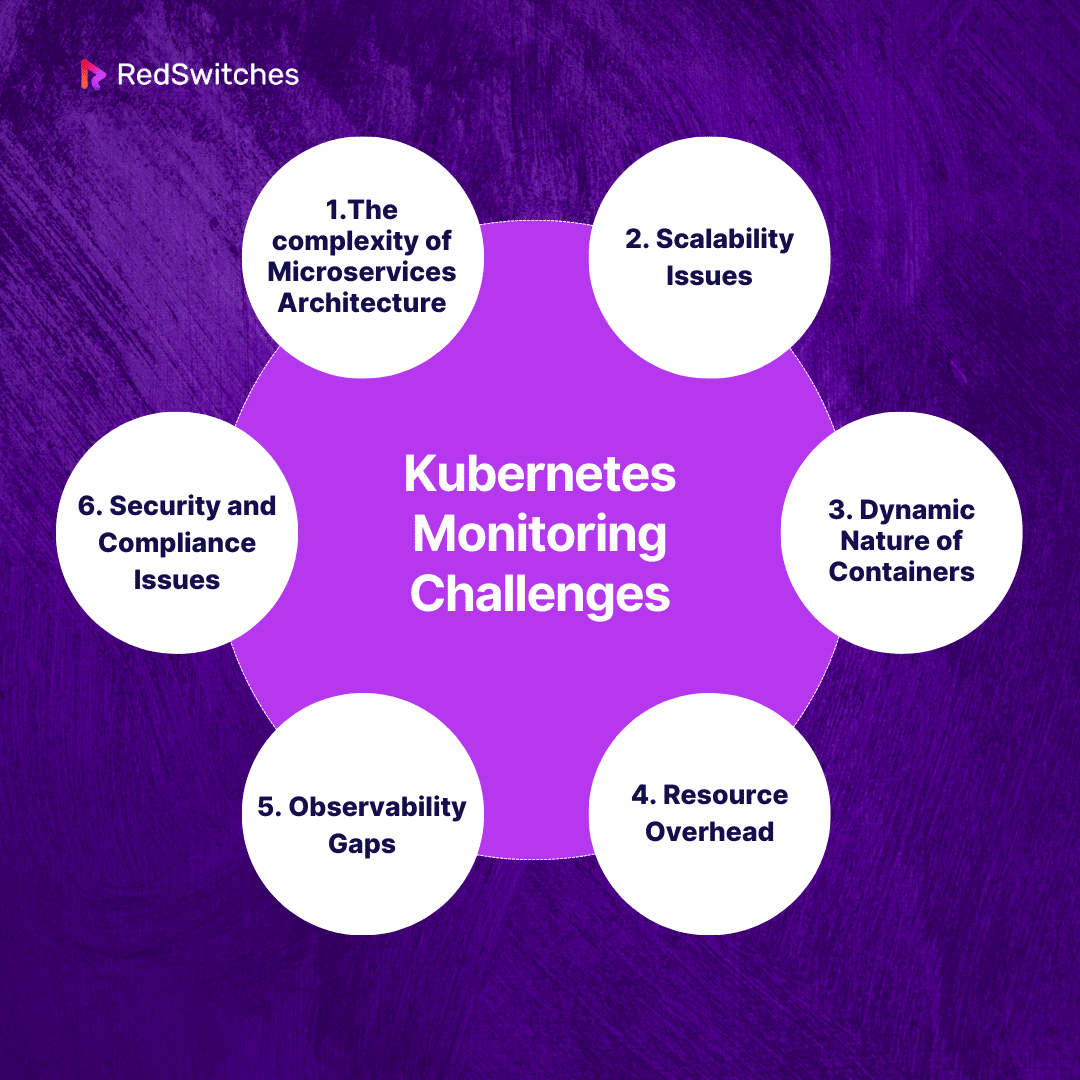
Kubernetes Monitoring is very advantageous. However, it also has several challenges. Let’s Discuss them.
The Complexity of Microservices Architecture
Kubernetes cluster management and microservices monitoring can be complex. Because microservices have many interconnected components and are dynamic, it might be challenging to trace and monitor the flow of requests and effectively identify problems.
Scalability Issues
Complexity in monitoring increases with the scale of Kubernetes deployments. Handling many pods, nodes, and services demands powerful monitoring solutions capable of handling increased data volume and offering valuable insights without overwhelming the system.
Dynamic Nature of Containers
Containers in Kubernetes are dynamic in nature; they frequently scale up or down in response to demand. This dynamic nature may be too much for traditional monitoring solutions to keep up with, making it challenging to track and monitor containerized workloads regularly.
Resource Overhead
Adding more components or monitoring agents may require using significant cluster resources. Balancing resource overhead reduction with extensive metric collection is a never-ending task for Kubernetes administrators.
Observability Gaps
Comprehensive observability, which includes metrics, logs, and traces, might be difficult to achieve. Careful planning and execution are needed to integrate all three elements flawlessly for an overall picture of the cluster’s health and performance.
Security and Compliance Issues
Monitoring sensitive data stored in containers and ensuring security regulations are followed might be difficult. Organizations must have monitoring systems that effectively mitigate security risks while maintaining data integrity.
Also read What is Server Clustering & How Does it Work? + 3 Main Benefits
4 Kubernetes Monitoring Best Practices
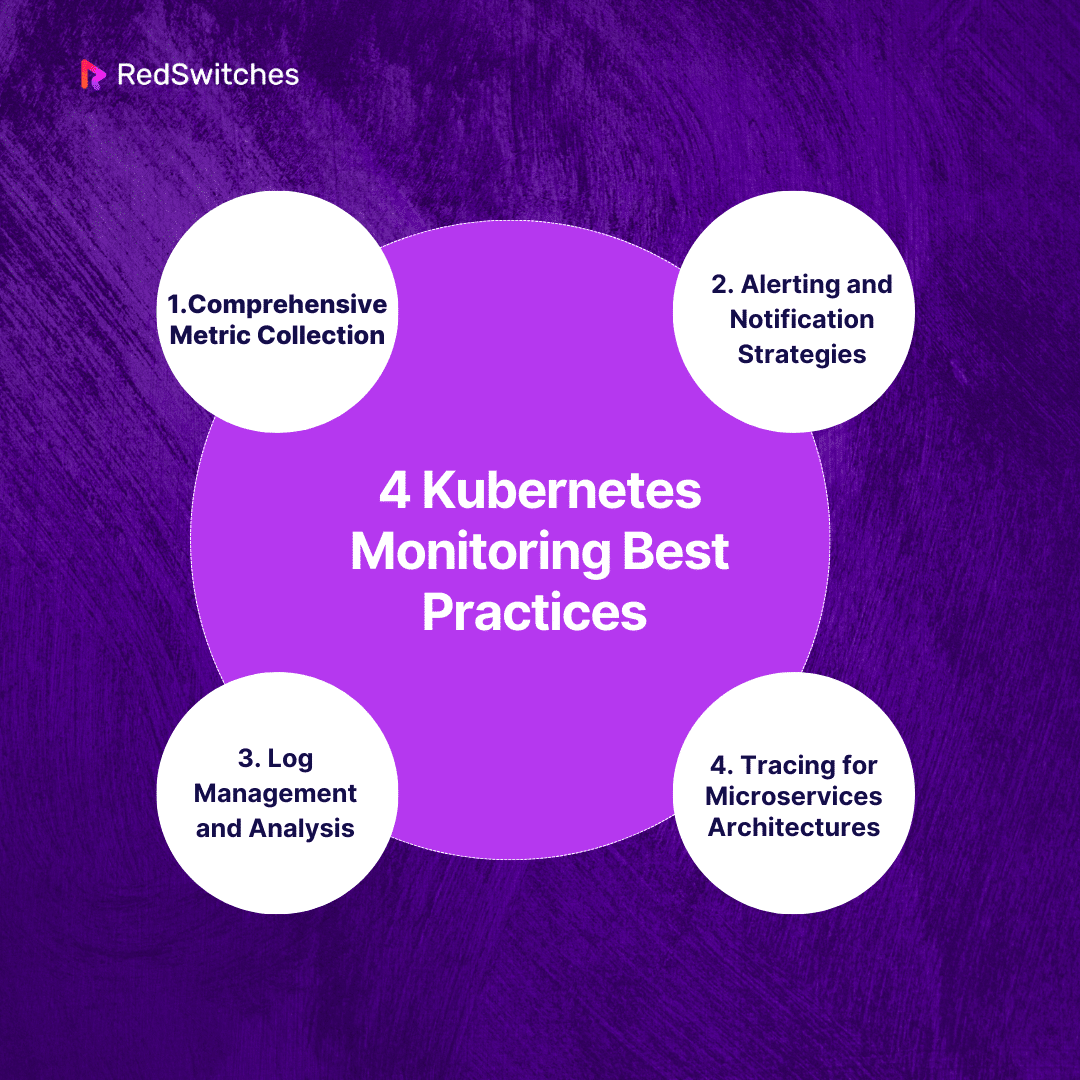
After discussing the Kubernetes Monitoring challenges, let’s discuss the best Kubernetes practices.
Comprehensive Metric Collection
Sufficient oversight of Kubernetes settings is essential to guaranteeing applications’ dependability, efficiency, and safety. One important best practice is using a comprehensive strategy for metric gathering.
To do this, a wide range of metrics covering various aspects of the Kubernetes cluster must be gathered. Resource limitations for nodes are easier to find when CPU, memory, disc usage, and network metrics are tracked.
Monitoring resource usage at the pod level offers information about bottlenecks and optimizes resource distribution. Additionally, bespoke application metrics provide an in-depth understanding of service-specific behavior, and Kubernetes component monitoring guarantees the health and performance of the control plane.
Alerting and Notification Strategies
Adopting effective alerting and notification systems is a crucial additional best practice. Issues can be found quickly thanks to proactive alerting based on predefined criteria and conditions.
Timely replies are ensured by defining pertinent alerts, creating escalation policies, and using multiple notification channels, such as email or collaborative platforms.
Testing the alerting system regularly ensures its effectiveness and that the incident response mechanism is operating as intended.
Log Management and Analysis
Kubernetes monitoring, log management, and analysis represent another crucial best practice. Implementing a centralized log storage system like ELK or Fluentd makes aggregating logs from nodes, pods, and containers possible.
Applications that use structured logging are easier to parse and analyze. Using real-time log analysis tools and defining log retention policies can assist in controlling storage expenses and spot patterns or anomalies for compliance requirements and troubleshooting.
Tracing for Microservices Architectures
Organizations using microservices architectures must implement distributed tracing. Integrating trace instrumentation with microservices using programs like Zipkin or Jaeger makes monitoring the movement of requests between services possible. Visualization tools help find performance bottlenecks and understand dependencies.
Enhancing traces with contextual information, such as request parameters and headers, enables deeper examination while troubleshooting. Tying traces to metrics and logs can provide an all-encompassing picture of an application’s behavior and performance.
Conclusion
To wrap up, monitoring Kubernetes is key to running and improving systems full of containers. It helps ensure everything runs smoothly, especially when dealing with complex setups of many small services.
In this article, we examined monitoring Kubernetes and discussed its crucial role in keeping things secure, reliable, and fast. We also showed businesses how to handle the tricky area of managing many containers, discussed the five best tools for this, and shared four top tips.
As more and more businesses need strong and flexible Kubernetes setups, working with leading companies like Redswitches can help. They offer tailored monitoring solutions that fit different needs.
Using the latest technology and the best methods. Companies can confidently take on Kubernetes monitoring. This improves their operations and ensures their container-based projects do well, with help from RedSwitches.
FAQs
Q. What is monitoring in Kubernetes?
To guarantee optimal operation and resolve faults, monitoring in Kubernetes entails tracking and analyzing the performance, health, and resource utilization of containerized apps within a Kubernetes cluster.
Q. Does Kubernetes have built-in monitoring?
Yes, Kubernetes comes with an integrated monitoring solution in the form of tools like the Kubernetes Dashboard, which gives managers a web-based interface to see and examine cluster data and the health of their applications.
Q. What is Kubernetes used for?
Kubernetes automates containerized applications’ deployment, scaling, and management. In large-scale, distributed settings, it ensures consistency and efficiency by streamlining the process of managing containerized workloads.
Q. What are the key metrics to monitor in a Kubernetes cluster?
Key metrics to monitor in a Kubernetes cluster include CPU usage, memory utilization, network activity, storage usage, and the number of running pods and nodes.
Q. How can I effectively monitor my Kubernetes applications?
You can effectively monitor your Kubernetes applications by using monitoring solutions that provide visibility into your cluster’s performance, resource utilization, and overall health. Tools like Grafana and Prometheus are commonly used for this purpose.
Q. Why is it important to monitor Kubernetes?
It is important to monitor Kubernetes to ensure the proper functioning of your containerized applications, identify potential issues or bottlenecks, optimize resource utilization, and ensure your cloud-native environment’s overall stability and performance.
Q. What are the best practices for Kubernetes monitoring?
Best practices for Kubernetes monitoring include collecting metrics related to your pods, nodes, control plane, and overall cluster performance. Additionally, it involves implementing effective monitoring and observability tools, setting up alerts for critical issues, and regularly reviewing and optimizing your monitoring setup.
Q. Which tools are commonly used for monitoring and observability in Kubernetes?
Commonly used tools for monitoring and observability in Kubernetes include Grafana, Prometheus, Datadog, Elastic Stack (ELK), and Splunk. These tools provide capabilities for collecting, visualizing, and analyzing various metrics and logs within your Kubernetes environment.
Q. How can I monitor and troubleshoot issues within my Kubernetes cluster?
You can monitor and troubleshoot issues within your Kubernetes cluster by using monitoring solutions that offer real-time visibility into your cluster’s performance, resource metrics, logs, and events. Additionally, having a well-configured Kubernetes dashboard can help quickly identify and address any issues.
Q. What are the key components to monitor in a Kubernetes cluster?
The key components to monitor in a Kubernetes cluster include the control plane metrics, resource utilization across pods and nodes, network activity, container health, and the overall performance and availability.
Q. How can I monitor the logs of my Kubernetes applications?
You can monitor the logs of your Kubernetes applications by leveraging logging solutions such as Elasticsearch, Fluentd, and Kibana (EFK stack) or tools like Loki. These tools enable you to collect, store, and analyze logs from your Kubernetes pods and applications.
Q. What role does Grafana play in Kubernetes monitoring?
Grafana is commonly used for visualizing and analyzing the metrics and performance data collected from a Kubernetes cluster. It provides customizable dashboards, alerting capabilities, and the ability to create insightful visualizations for monitoring the health and behavior of your Kubernetes resources.
Q. How can I monitor the resource metrics of my Kubernetes cluster?
You can monitor the resource metrics of your Kubernetes cluster by using tools and plugins that allow you to collect and analyze data related to CPU, memory, storage, and network usage across your cluster’s workloads, pods, and nodes.