How to Check Memory Usage in Linux – 6 Quick Ways
This simple guide to how to check Linux memory usage lists five command-line and a GUI based methods that you can use to monitor RAM allocation and usage.

Memory management is a vital aspect of keeping a Linux system running smoothly.
Whether you’re a system administrator, a developer, or just a curious user, knowing how to check memory use in Linux is critical for guaranteeing the stability and performance of your system.
RAM is a valuable resource, and monitoring its utilization can assist you in identifying and resolving issues such as memory leaks or low memory because of resource-hungry processes.
This post will look at six ways of monitoring and checking memory use in a Linux environment. We will cover utilities such as top, vmstat, ps, and htop to show Linux memory usage in the terminal. Next, we will cover the process of checking available memory in Linux through the GUI.
So, whether you prefer command-line tools or graphical interfaces, by the end of this article, you’ll have a firm grasp on assessing your system’s memory utilization while keeping your Linux system running smoothly.
Let’s start with the prerequisites and then move on to the five ways to check memory usage in Linux.
The Prerequisites to Checking Available Memory in Linux
Here’s what you need to try out the five methods we’ll discuss in this tutorial:
- A system running a mainstream Linux distribution
- Access to a command line or a terminal
- A user account with sudo or root permissions
- The system should have a package manager (we’ll use APT)
System memory (RAM) is just one of the critical specifications you need for smooth server operation. Here’s our guide to choosing the best dedicated server resources for your projects.
Method #1: Check Memory information in the Linux meminfo File
The easiest method is to use the cat command to view the contents of the /proc/meminfo file. For this, enter the following command in the terminal:
$ cat /proc/meminfo
The meminfo file in Linux systems tracks how much memory is available and consumed by various processes. It has real-time data on the system’s memory utilization and the kernel’s use of shared memory and buffers. Since this data is closely tied to the system, the contents of the local Linux meminfo file could vary slightly depending on the architecture and operating system.
For instance, here’s how the /proc/meminfo file looks like on our test Ubuntu machine:
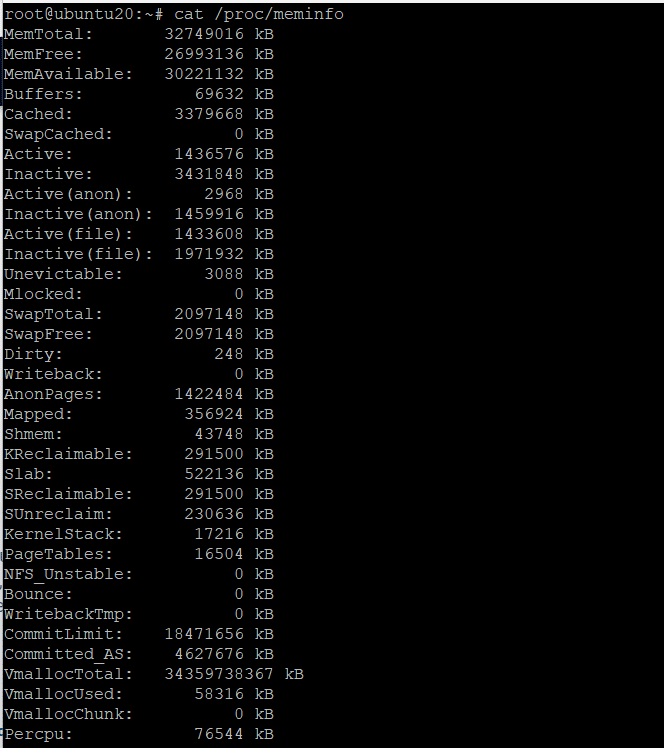
You can see that the system uses kilobytes as the unit for system memory. You have to do some quick math to translate the numbers in GBs.
Here are the six important fields you should check in the contents of the meminfo file:
- **MemTotal** and **MemAvailable**: Indicate system memory capacity and what’s currently available for applications.
- **Buffers** and **Cached**: Show how the system is using memory for temporary storage and caching.
- **SwapTotal** and **SwapFree**: Indicate swap usage, which is critical when the system is running low on RAM.
Method #2: Use the free Command to See the Physical and Swap Space Memory Capacity
Most Linux distributions offer free, a simple command that prints the available and consumed memory statistics.
Run this command to call the utility in the terminal:
# free
Here’s the output on our test machine:
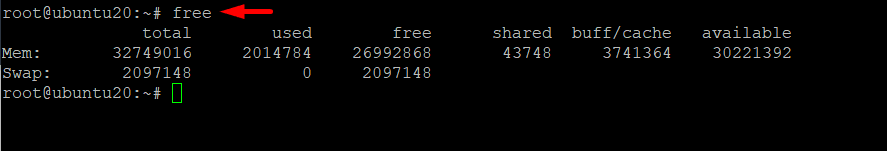
Let’s explore this output in detail to find out what each entry indicates.
| total | The total physical memory installed on the system |
|---|---|
| used | The memory used by the processes (used = total – free – buff/cache) |
| free | The memory that isn’t currently in use (free = total – used – buff/cache) |
| shared | The memory shared by system processes |
| buffers | The memory the OS has set aside to allot as buffers when processes raise a demand |
| cached | RAM-stored files |
| buff/cache | Buffers + Cache |
| available | The available memory new apps can use without swapping. |
As you can see, the free command gives less information than the contents of the Linux meminfo (/proc/meminfo **)**file. However, this output is easier to comprehend. The crucial metric is the available value, which shows how much total physical memory (system RAM) is still available for new applications.
You can customize the output of the command by adding flags at the end. Here are some useful flags you can add to the command to check available RAM.
| Options | Result |
|---|---|
| -b | Changes memory usage/availability figures to bytes |
| -k | Changes memory usage/availability figures to kilobytes |
| -m | Changes memory usage/availability figures to megabytes |
| -g | Changes memory usage/availability figures to gigabytes |
| -l | Shows detailed low and high memory statistics |
| -o | Revert output to an old format (no -/+buffers/cache line) |
| -t | Shows the total sum of RAM + swap |
| -s | Updates the output every [delay] seconds |
| -c | Updates the output by [count] times |
Also Read: Master the Linux Free Command: 6 Examples For Sysadmins and DevOps Engineers
Method #3: Use the vmstat Command to See Virtual Memory Usage
vmstat (Virtual Memory Statistic Reporter) offers comprehensive insights into system performance aspects, including processes, total physical memory, memory usage, paging, block IO, traps, and CPU activity.
Here’s a sample output of the command:
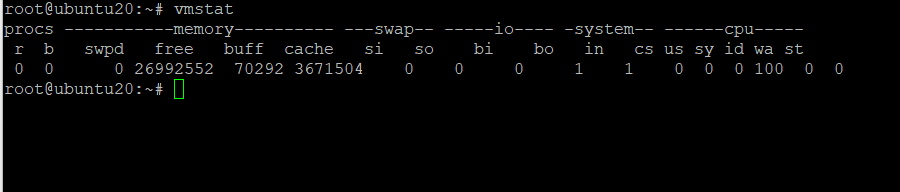
When checking available RAM, this output can confuse first-time users because of the details. Let’s go into these details to see what these headings represent.
- **Procs (Processes)****r**: the number of processes pending execution.**B**: The number of uninterrupted sleep processes

- **Memory****swpd**: The utilized virtual memory size.**free**: The unused memory space.**buff**: The portion of RAM used as buffers.**cache**: The RAM space used for caching.

- **Swap****si**: swapped-in memory from disc (/s).**so**: swapped memory for disc (/s)

- **IO****bi**: Blocks received per second (blocks/s) from a block device.**bo**: Blocks per second (blocks written to a block device)

- **CPU (These are percentages of total CPU time)****us**: running time devoted to non-kernel code. (User time, pleasant time included)**sy**: Duration of kernel execution. (Time on system)**id**: Length of downtime.**wa**: The amount of time spent waiting out for IO.**st**: Virtual machine time that has been stolen.
Method #4: Use the top Command to Display Memory and CPU Usage
The top command shows detailed information about memory and CPU usage by process. It shows the following details about the system processes:
- uptime
- average weight
- task execution,
- Count of users who have logged in
- CPU usage and utilization
- swap system processes, and memory
Since the command constantly updates the data, you can use it to view memory consumption as it happens.
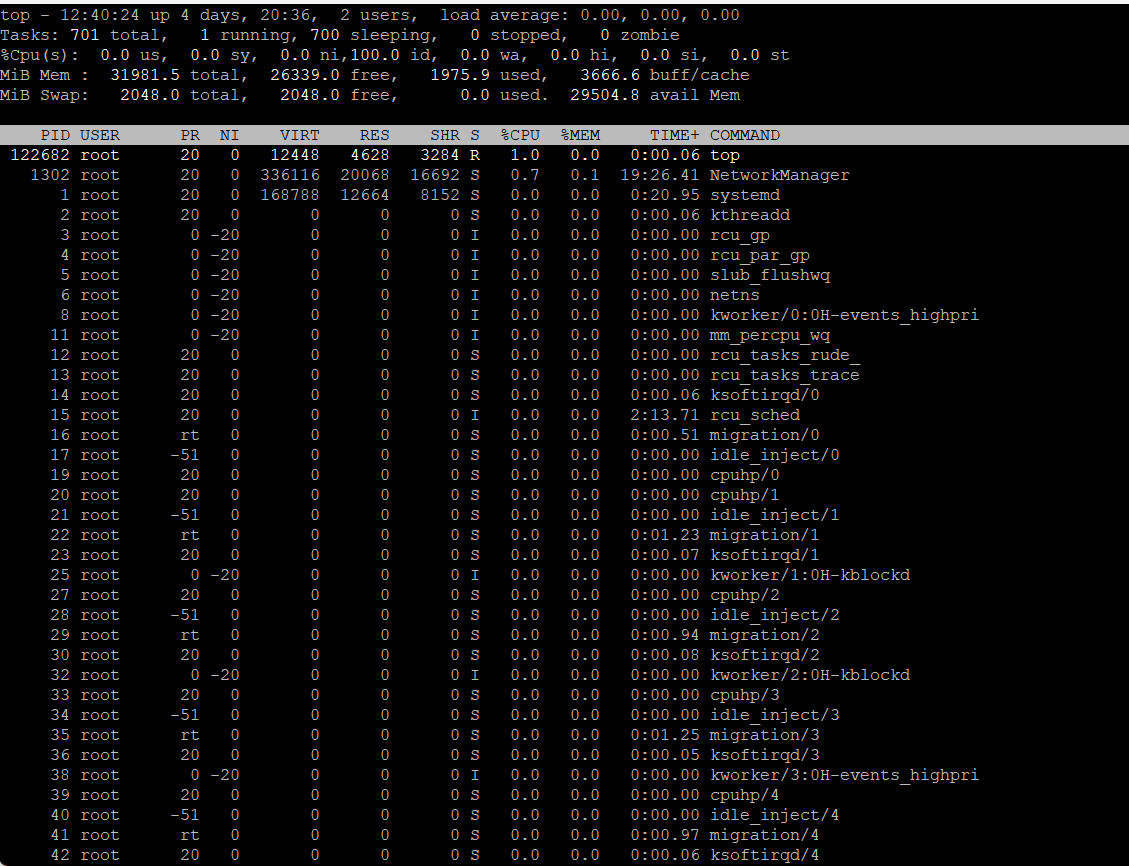
The top command shows a near real-time view of the running processes. You can use various flags to see specific information about how processes consume system memory and CPU. We recommend using theman top command to see the list of these flags and options.
Sort top Output by Memory
When using top, sort by memory to see the processes that are consuming the most RAM. Since top produces near-realtime output, sorting the output by memory is a great way of quickly recognizing processes occupying the system RAM.
Launch the top utility and press shift + m to sort the output by memory consumption.
Present top Output in Human Friendly Format
When using top, human readable output is a serious shortcoming. The modern Linux systems have RAM in gigabytes (GB) while the utility outputs in kilobytes (KB). You can easily convert the output in the top half of the output by pressing shift + e.
Method #5: Use the htop Command to See Each Process’s Memory Load
Thehtop command has a pretty similar output to the top command we discussed in the previous entry. The main benefits of using the htop commands are its user-friendly interface and improved control options.
Users prefer this command over the top command because of the multiple flags, the option to scroll vertically and horizontally, and the colorful output.
Let’s see the command in action.
#htop
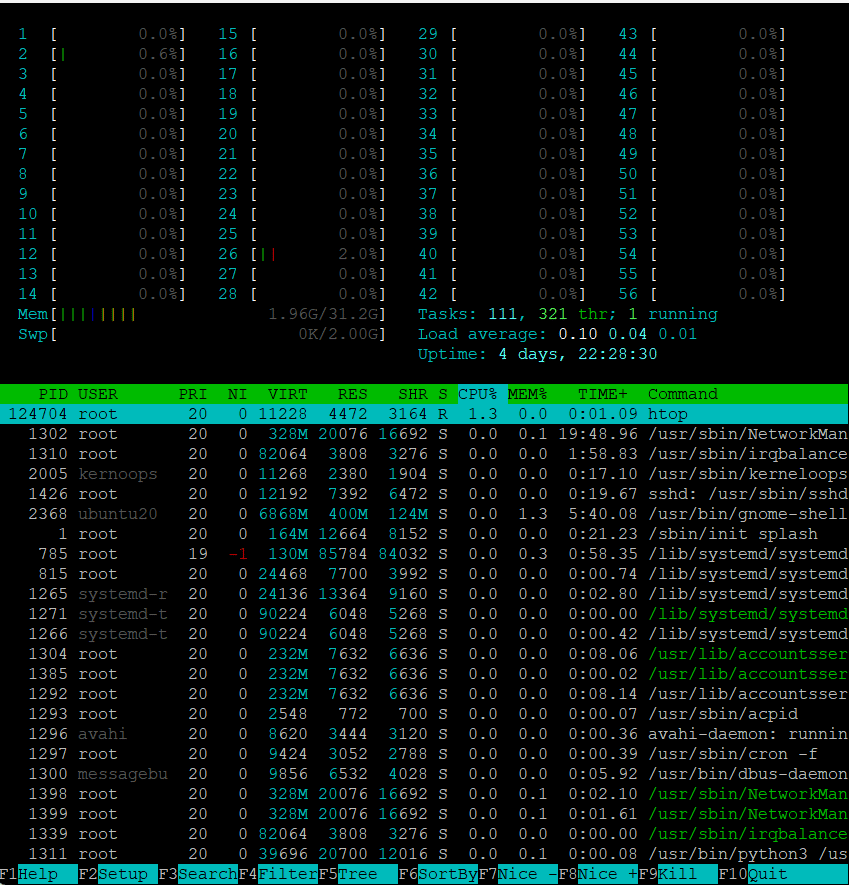
Let’s go into the details of this output:
The top part gives a summary of the system’s resource usage. This data gives you a quick overview and simplifies how to check memory usage in Linux systems.
The lower portion contains the details for every running process. This detailed breakdown helps you identify processes that are consuming too much memory and CPU time.
You can further change the details and format of the output by using the commands listed at the bottom.
You should note that htop is not installed by default on some Linux systems. If that’s the case with you, simply install it by running the following command :
$ sudo apt install htop
Do you know that not enough memory is often a common reason why servers lag and crash. That’s why we have included server specifications in our detailed overview of managed dedicated servers.
Method #6: Use the ps Utility to View Process Memory Consumption
You can also view Linux memory usage by a specific user by running the ps command. The exact syntax of the command is as follows:
# ps -u <username> -o pid,%mem
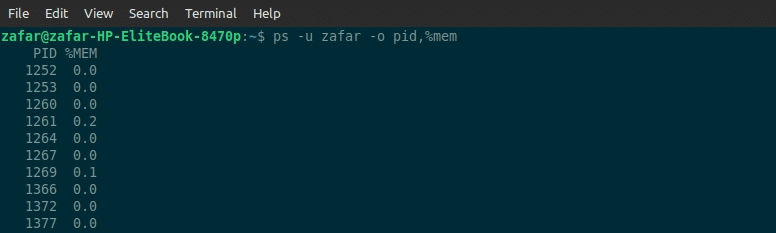
As you can see, the command outputs the process ID (PID) and the percentage of the memory consumed by the process.
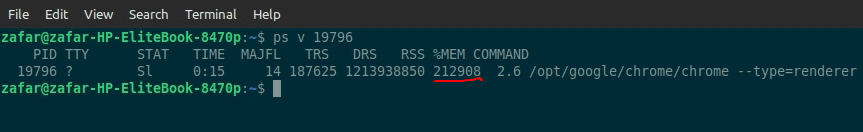
View Memory Consumption by a Specific Process
An interesting use case of the ps utility is to check Linux memory usage by a specific process. This is often useful if you suspect a process of consuming too much RAM. In the context of ps show memory usage, the syntax of the command will be as follows:
# ps v <PID>
The output of the command is very detailed and includes memory consumption in KB.
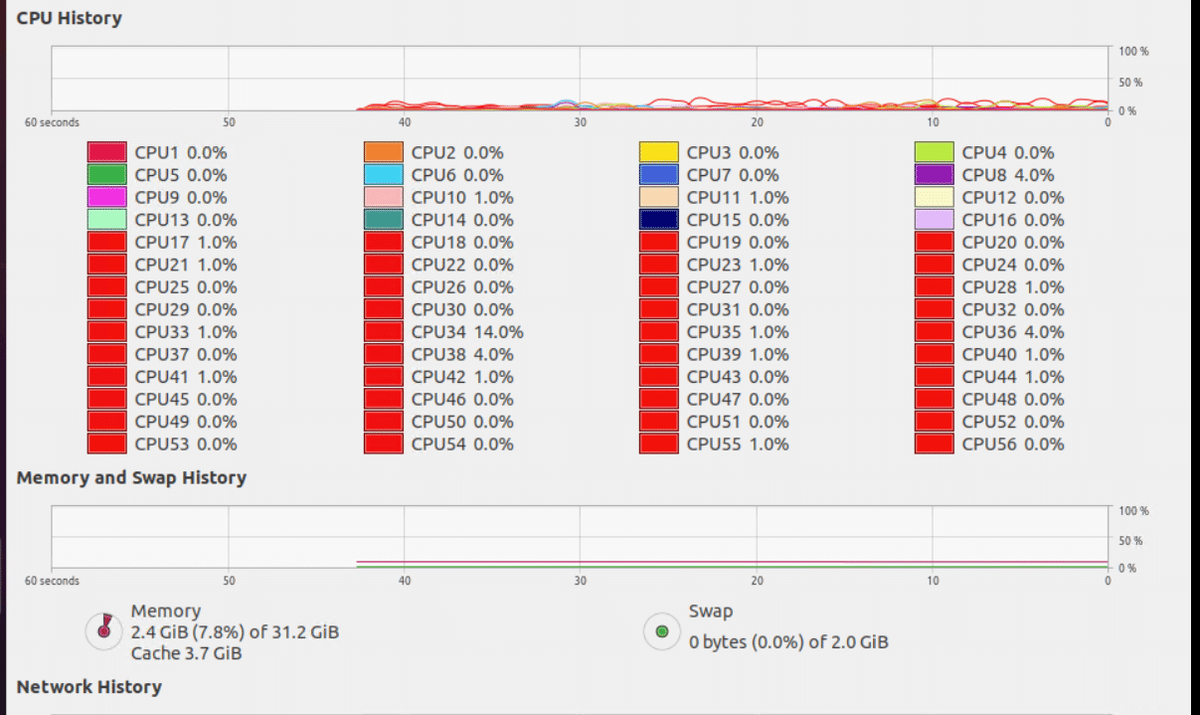
Command line tools are quick, but they often don’t have user-friendly output. If you prefer the GUI over the command line, you can use the System Monitor utility to visually check memory usage in Linux systems.
We’ll use Ubuntu to demonstrate, but the process of launching and using the utility remains the same on all distros.
Launching System Monitor is easy – simply go to Show Applications. Type System Monitor into the search box to open the utility.
Once the program is active, click the Resources tab. You can see a graphic representation of the memory usage in real time. You can also view historical data for better comparison and analysis.
Tips For Tracking Memory Usage in Linux
Monitoring memory usage in Linux is crucial for efficient system management. Here are five easy ways to keep track of your system’s memory resources.
- Utilize basic commands like **free** or **top** to check current memory usage and identify memory-hungry processes.
- Keep an eye on swap memory usage, as excessive swapping can indicate memory issues.
- Explore graphical tools for a visual representation of memory usage statistics. These tools offer a more intuitive understanding of memory usage patterns.
- Check the **Processes** tab of resource monitors to analyze process activity and memory utilization statistics in detail.
- Engage with the current community for developers on platforms like Stack Exchange for the latest information on memory management techniques, including setting memory thresholds and ensuring effective memory management for optimal resource utilization.
Conclusion
Keeping track of your Linux system’s memory utilization is essential for maintaining its health and maximizing its performance. We described five simple commands you can try to check memory usage in Linux environments. By routinely utilizing these commands, Linux users and administrators can maintain their system’s effectiveness and responsiveness while avoiding potential performance concerns.
How to check memory usage in Linux is just one of the skills our support team uses every day to ensure our users have a high-performing bare metal infrastructure for their projects.
FAQs
Q. Why is monitoring memory usage significant in Linux?
A1: Monitoring memory usage is crucial in Linux to ensure efficient resource allocation, prevent performance issues, and troubleshoot system bottlenecks. It helps maintain system stability and responsiveness.
Q. What is the free command, and how can I check memory usage?
A2: The free command displays information about total, used, and free memory in your system. Running free with options like ‘-m’ (megabytes) or ‘-g’ (gigabytes) provides memory statistics in a more human-readable format.
Q. What are the 5 commands to check memory usage in Linux?
The 5 commands to check memory usage in Linux are free, top, vmstat, sar, and htop.
Q. How can I check memory usage on a Linux system using the command line?
You can check memory usage on a Linux system using commands such as free, top, vmstat, sar, or htop in the terminal.
Q. What is the command to check memory usage in Linux?
The command to check memory usage in Linux is the free command, which shows the total amount of free and used memory on your system.
Q. How to view memory statistics in Linux?
You can view memory statistics in Linux by using commands like free, top, vmstat, sar, or htop to check the memory usage and availability.
Q. How can I check the amount of memory used by Linux?
To check the amount of memory used by Linux, you can use commands like free, top, vmstat, sar, or htop to monitor the system’s memory usage.
Q. What are some ways to check memory usage on a Linux operating system?
You can check memory usage on a Linux operating system by using commands like free, top, vmstat, sar, or htop to monitor the system’s memory usage and performance.
Q. Can I make top human readable for systems with GBs of system memory?
By default, top displays system memory in KB. You can change to more people-friendly output by pressing shift + h to change the units in the display.
You can check the total amount of memory in use on a Linux system by using commands like free, top, vmstat, sar, or htop to view the memory statistics.
Q. How to do Linux top sort by memory?
You can easily sort top by memory to see better human-readable output and a quick analysis of memory usage. In the top utility, you can press shift+mto sort the output of the utility.
Narendra
Data Center Engineer
At RedSwitches, Narendra works as a data center engineer full-time. He is in charge of the RedSwitches Asia DC, based in India. His area of expertise is server hardware, rack and DC operations, and resolving OS-level concerns.

Ubuntu vs Linux: Key Differences Explained
Linux is the kernel, while Ubuntu is a complete operating system built on it. This guide breaks down their key differences, use cases, and when to choose each.

Reduce Docker Image Size: Best Practices to Slim Your Images
Docker image size can become a serious issue as you add more code to the image. Learn how to reduce Docker image size and optimize Dockerfiles for production to speed up CI/CD pipelines and improve container efficiency.

Best Linux Distros 2026, Full Guide for Beginners, Developers, Gamers & Servers
Match your hardware, workflow, and skill to the right Linux distro in 2026. Compare 23 top picks, Mint, Ubuntu, Fedora, Arch, Bazzite, covering beginners, developers, gamers, and servers.
Power Your Next Project With Bare Metal
10 min delivery, zero setup fees, and 24/7/365 human engineers across 20+ global locations.