What Is Linux Average Load? [6 Monitoring Tools Inside]
Learn all about Load Average in Linux and how it represents CPU usage over time. Explore the metric, uptime command, and its impact on system performance
![What Is Linux Average Load? [6 Monitoring Tools Inside]](https://cdn.sanity.io/images/ksh2rme6/production/abdc25b4d7b247bc2b837cde1dab69681e855aeb-1053x707.png?w=1400&q=75&fit=max&auto=format)
Resource consumption is one of the most frequent worries of system administrators.
That’s because of the simple fact that if the available free resources (CPU, RAM, and Storage) fall below a certain threshold, the applications running on the server could become unresponsive and affect the user experience.
In Linux, the Load Average is a crucial indicator of how much the system resources are used at any given time. System administrators should know how to interpret and handle this metric because of its importance in pinpointing and fixing system performance problems.
In this guide, we will discuss the idea of Load Average in Linux. We will also explore several options for monitoring CPU load on your system.
Let’s start with a look at the idea of Load Average in the context of a Linux system.
Understanding Load Average in Linux
Linux Load Average is a measure that tells us how busy the CPU (the main processor of the computer) is with current tasks and those lined up to be processed.
Note that this is different from CPU Usage, which gives us a snapshot of how much the CPU is being used at a particular moment. Load Average, on the other hand, shows us how this usage changes over time. Usually, the system calculates this metric by averaging the number of active and waiting tasks over the past 1, 5, or 15 minutes.
A high Load Average number indicates that the system has a higher number of tasks being processed or waiting in the queue. As such, this metric signals higher usage of the CPU resources.
What is Considered a Normal Load Average in Linux?
The “normal” Load Average in Linux varies depending on how many CPUs and cores are installed on the system.
Systems with dual CPUs can handle more tasks simultaneously, which usually means a lower load average. However, as the volume of tasks goes up, the load Average will go up, regardless of the number of CPU units on the system.
The number of cores in the system also matters. If you see a high Load Average on a system with just a few cores, it is too busy and struggling with completing the processing tasks. In contrast, in a low Load Average situation in a system with several multi-core CPU units, the resources aren’t fully used and you can add more tasks without overwhelming the system.
A good rule of thumb is that a Load Average lower than the number of CPU cores is typically okay. This number means enough free CPU resources are available for the current and future processing tasks.
For instance, a Load Average under 4 would be normal for a system with a four-core CPU. But if it’s consistently higher than 4, the system is potentially jam-packed and struggling to get ahead of the queued processing tasks.
On the other hand, a Load Average of 0 doesn’t mean nothing is happening. In fact, this number could indicate that the system might still be running some background tasks or small jobs.
How to Monitor CPU Load Average in Linux Environment?
Monitoring the Load Average in Linux is an essential requirement because admins can use it to keep track of system performance and the efficiency in system resource utilization.
Given this importance, it is no surprise that you can find multiple command-line tools to check the Load Average in the Linux server environment. We will now discuss six tools you can try out to measure the Load Average in Linux servers.
The Prerequisites
Before you try out one or more tools we will discuss later on, make sure you have the following:
- A basic understanding of Linux commands.
- An account with administrator or sudo privileges.
Tool #1: The uptime Command
You can use the uptime command in Linux to view the Load Average over the 1, 5, and 15-minute intervals. When you run this command, it shows not only the system’s Load Average but also how long the system has been up since the last boot and the current number of logged-in users.
**# u****ptime**

We ran the command on our test system, and the output indicated that the system had been up for 12 minutes with 2 active users. The Load Average numbers are as follows:
- A Load Average of 0.36 for the past 1 minute.
- A Load Average of 0.22 for the past 5 minutes.
- A Load Average of 0.08 for the past 15 minutes.
These numbers represent the Average Load per user. The system determines the number by dividing the total number of processes that are either running or waiting for CPU time by the number of CPU cores available in the system.
Tool #2: The top Command
You can use the top command for a real-time look at the processes running on your system. This powerful tool not only displays information about processes but also includes details about the load percentage and the utilization of various system resources.
Run the following command to use this tool to check the system Load Average:
# top
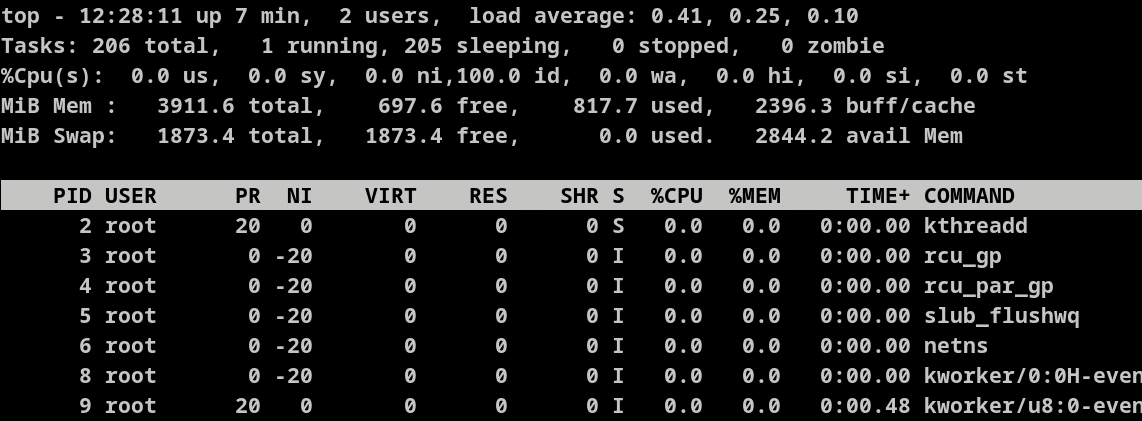
Once the command starts showing the stats, you can find the Load Average information right at the beginning of the output, along with other essential system resource statistics.
If you wish to explore the full capabilities of the utility, we recommend our comprehensive guide to using the top command to view process information.
Tool #3: The htop Utility
htop is an interactive Linux process monitoring tool that offers features beyond the basic top utility. It provides a user-friendly interface for monitoring system statistics and managing processes through vertical and horizontal views.
You can navigate the utility with the help of the supported shortcut keys.
# htop

Note that htop is not included in several Linux distributions. If that’s the case with your system, you can easily install it through the system’s package manager.
Tool #4: Check the Load Average Stats in /proc/loadavg
If you prefer a more straightforward approach to seeing the Load Average on your Linux system, we recommend printing out the contents of the /proc/loadavg in the terminal through the cat command.
**# c****at** **/proc/loadavg**
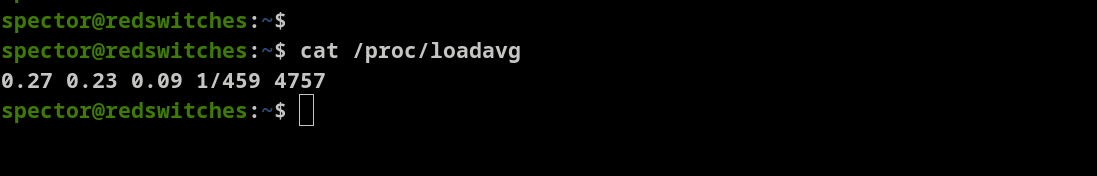
This is a great way of looking at the system’s Load Average without clutter on the screen.
Here’s a brief overview of the output:
- The first three numbers of the output signify the Load Average over 1, 5, and 15 minutes.
- The fourth number indicates the number of active processes (1) and the total count of processes (459).
- The last number is the process ID of the most recently generated process.
Tool #5: The w Command
The wcommand offers another simple method of viewing the Load Average in Linux. When you run the command, it provides a summary that includes the Load Average on the first line of the output.
To view the Load Average using the wcommand, simply enter:
# w
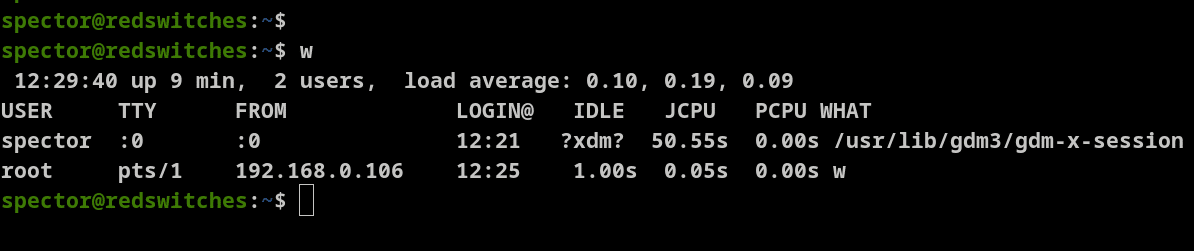
The first line of the output presents information about the users, system time, uptime,, and the average load on the system.
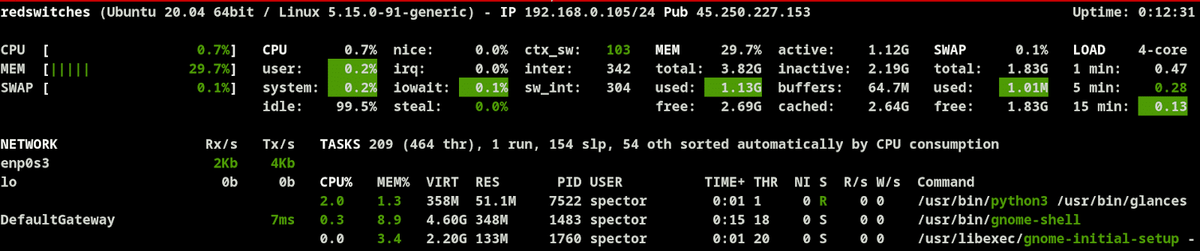
Tool #6: The glances Tool
glances is a powerful Linux system monitoring tool that offers a comprehensive overview of system resources. It functions similarly to the top utility but provides a more extensive set of system details.
Since glancesisn’t usually available by default on most Linux distributions, we recommend following these steps to install it before using it.
Begin by updating the system package repository:
**# s****udo** **apt** **update**

Next, install the glances package:
**# s****udo** **apt** **install** **glances**
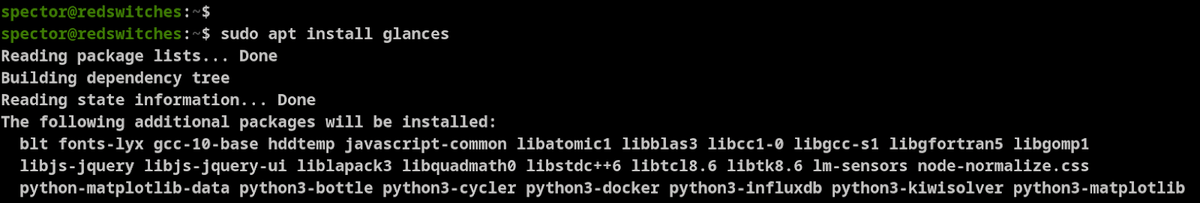
Once the installation is complete, simply execute the glances command:
# glances
The command opens up the glances interface, where you can access various system information, including the Load Average (conveniently located in the top right corner of the display).
How to Increase Load Average in Linux?
Raising the Load Average on a Linux system is generally not recommended as it can strain the system. However, increasing the Load Average might be necessary in specific scenarios, such as when performing stress tests.
The average load increases in the following scenarios:
- You launch more applications or initiate processes that demand higher resource usage.
- Improved code efficiency or executing processes concurrently can reduce the completion time for each process.
- When the number of active users on the system increases significantly.
- You can schedule multiple additional tasks for automatic execution using tools like cron.
- Run tasks that are heavy on CPU usage, such as complex calculations, encryption/decryption, or data compression/decompression.
- Increase the number of threads used by a process to enhance its workload.
How to Decrease Load Average in Linux?
For most Linux servers, it’s ideal to maintain a Load Average that is less than the total number of CPU cores. When the load exceeds this threshold, the system starts to experience considerable stress.
To reduce the Load Average on your Linux system, start by using the tools like top, htop, orps to pinpoint the processes and applications causing the high load.
After identifying the culprits, you can take several steps to reduce the Load Average:
- Upgrade to a more powerful CPU to enhance the system’s processing capability.
- Expand the system’s RAM to minimize swapping (data is moved between RAM and the drive), thus boosting the overall system performance.
- Fine-tune the performance of active processes by optimizing their configuration, lowering their memory demands, or adjusting their priority levels.
- Schedule non-urgent tasks for later execution using schedulers like cron, anacron, or at. This helps in spreading out the system’s processing load.
- Employ containerization technologies, such as Docker or Kubernetes, for better process isolation and management.
- Terminate unnecessary processes. You can use the top or ps command to list active processes and the kill command to shut them down.
- Control the number of simultaneous users or stagger their usage to different times to reduce concurrent system load.
Conclusion
Understanding Linux’s Average Load is crucial for maintaining a healthy and efficient system. We discussed the idea of Linux Average Load in the context of servers and then mentioned 6 utilities that you can use to view the processes and understand the load on the system.
RedSwitches offers the best dedicated server pricing and delivers instant dedicated servers, usually on the same day the order gets approved. Whether you need a dedicated server, a traffic-friendly 10Gbps dedicated server, or a powerful bare metal server, we are your trusted hosting partner.
FAQs
Q. What is the Load Average in Linux?
Load Average in Linux is a metric that measures the average system load over a certain period. It represents the average number of processes in a runnable or uninterruptible state. It is a useful indicator of system activity and can help in understanding the CPU usage in a Linux system.
Q. How is Load Average calculated in Linux?
The Load Average is calculated as the average number of processes that are either in a runnable or uninterruptible state over a period of time. The Load Average is typically displayed for three different time periods: the last 1 minute, the last 5 minutes, and the last 15 minutes.
Q. What is considered a high Load Average in Linux?
A high Load Average in Linux can vary depending on the number of cores or CPUs in the system. As a general rule of thumb, a Load Average higher than the number of available CPUs indicates that the system is experiencing a higher load than it can handle efficiently.
Q. How can I interpret the Load Average values in Linux?
The Load Average values in Linux represent the average number of processes waiting for CPU time. Understanding the relationship between the Load Average and the number of CPUs in the system is crucial for interpreting these values effectively.
Q. Why is understanding the Load Average important for Linux users?
Understanding Load Average is important for Linux users as it provides insights into the system’s performance and helps in identifying when the system is under heavy load. It is essential for monitoring and optimizing system resources.
Q. What methods are available for keeping an eye on system load and Load Average in Linux?
You can monitor the system load and Load Average in Linux using tools such as ‘uptime’ and ‘top’ from the command line. These tools provide valuable information about CPU utilization and system load averages.
Q. What role does Load Average play in virtual machine environments?
In virtual machine environments, understanding the Load Average is crucial for monitoring the performance of virtualized systems. It helps in assessing resource utilization and optimizing the allocation of virtual CPUs and memory.
Q. What are the ways to utilize the Load Average for improving system performance in Linux?
Load Average can be used to identify periods of high load and determine when additional resources, such as CPU or memory, are required. Linux users can proactively address
Q. What are the ideal Load Average values for a Linux system?
A Linux system’s ideal Load Average values depend on the specific hardware and workload. Generally, an ideal Load Average is consistently below the number of available CPUs, indicating that the system is efficiently handling the workload.
Q. How does the Load Average represent the load on the CPU in Linux?
Load Average in Linux represents the load on the CPU by indicating the average number of processes waiting for CPU time. It provides insights into the system’s workload and can help understand CPU and memory usage.
Niranjan Bansode
System Administrator
Niranjan Bansode is a Linux system administrator who managed server operations at RedSwitches, ensuring the smooth and secure running of production infrastructure. Passionate about Linux and cloud systems, he now works in Linux and Azure cloud infrastructure administration.

Ubuntu vs Linux: Key Differences Explained
Linux is the kernel, while Ubuntu is a complete operating system built on it. This guide breaks down their key differences, use cases, and when to choose each.

Reduce Docker Image Size: Best Practices to Slim Your Images
Docker image size can become a serious issue as you add more code to the image. Learn how to reduce Docker image size and optimize Dockerfiles for production to speed up CI/CD pipelines and improve container efficiency.

Best Linux Distros 2026, Full Guide for Beginners, Developers, Gamers & Servers
Match your hardware, workflow, and skill to the right Linux distro in 2026. Compare 23 top picks, Mint, Ubuntu, Fedora, Arch, Bazzite, covering beginners, developers, gamers, and servers.
Power Your Next Project With Bare Metal
10 min delivery, zero setup fees, and 24/7/365 human engineers across 20+ global locations.