Linux is the backbone of most servers, data centers, and cloud environments. The smooth operation of these systems depends in a large part on the available RAM.
Sysadmins and DevOps engineers need to have an in-depth knowledge of the system’s memory usage so that they can take proactive decisions to prevent any performance bottlenecks, and optimize resource allocation.
The free command is a simple yet robust command that allows you to keep an eye on the Linux system’s memory usage. Admins use this command to get a snapshot of the total memory, used memory, and free memory.
In this comprehensive tutorial, you’ll learn how to use the linux free command. We will illustrate the capabilities of the command with six examples. Let’s start with an overview of the command.
Table Of Contents
An Overview of the free Command
The free command in Linux is a fundamental tool for monitoring RAM in a Linux environment. It monitors RAM consumption and helps admins determine whether there is enough space in RAM to run programs and maintain system performance.
The standard syntax of the free command is as follows:
# free [options]
Here, options are specific flags that you can add to get your desired output from the command. Note that executing the free command without options provides information on memory and swap usage in kibibytes.
Analyze the Command’s Output
The output of the free command provides several metrics about the system memory, including total, used, free, shared, buff or cache, and available. These columns in the output of the free command represents the following:
- Total: The total amount of RAM available on the system.
- Used: The amount of memory currently utilized by processes.
- Free: The quantity of unused memory.
- Shared: The amount of memory shared by multiple processes.
- Buff/Cache: The memory utilized by the kernel for buffers, page cache, and slabs.
- Available: The estimated amount of memory available for launching new applications, excluding swap.
The free command retrieves system memory information by parsing the contents of the /proc/meminfo file. This file acts as a repository for detailed memory usage statistics.
As you can see, the free command allows Linux administrators to gain an in-depth understanding of memory. They can use this information to manage, troubleshoot, and optimize systems.
The free Command Option
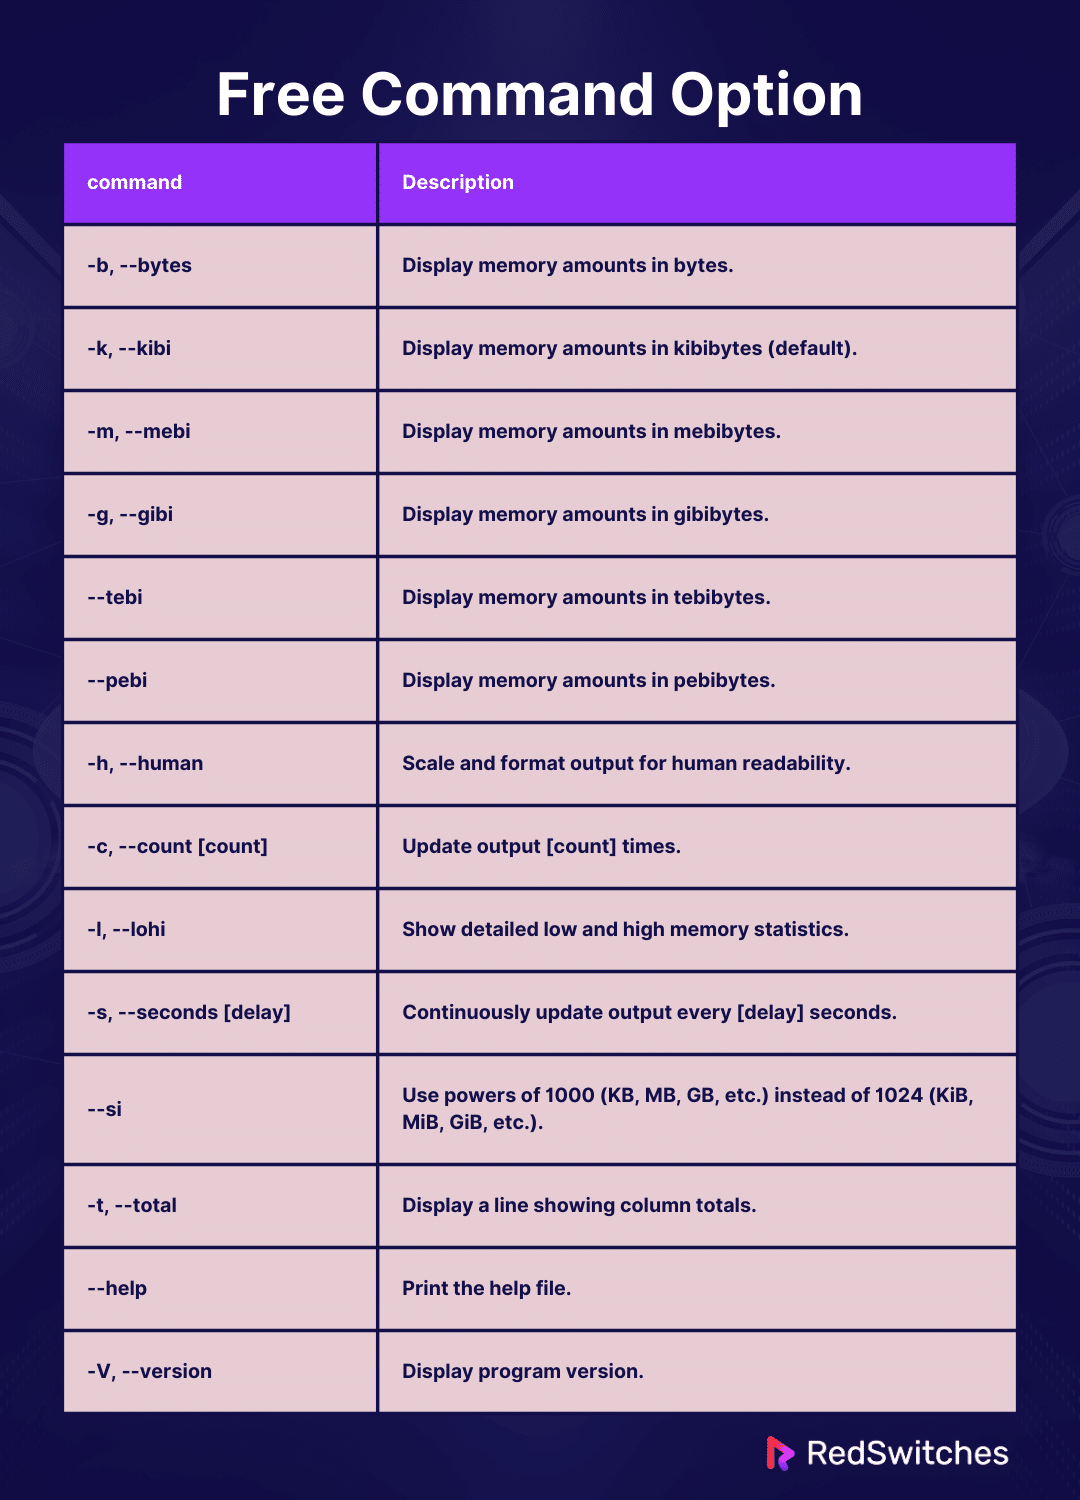
The free command can be tailored to show memory usage in any desired format. It offers various options to customize and format the output. The following table presents the most important options.
6 free Command Examples
The free command is an invaluable tool for managing and monitoring memory usage. The applications include displaying current memory usage, monitoring memory usage over time, identifying memory leaks, and checking for high buffer or cache usage.
The Prerequisites
Before proceeding, ensure you have the following:
- A system running a mainstream Linux distribution
- A user account with root or sudo privileges
Example #1: Output Memory Usage in Human Readable Format
The output of the free command is in kilobytes. This results in huge numbers because of the large volume of RAM on typical Linux systems.
It is important to output memory usage in human-readable format for various reasons, including ease of interpretation, clarity, and user-friendly interface. For this, use the -h option:
#free -h
This command displays memory size in human-readable units such as kilobytes (KB), megabytes (MB), or gigabytes (GB), making it easier to interpret memory usage on modern systems with large RAM capacities.
Example #2: Continuous Memory Usage Monitoring
Sysadmins and DevOps must keep an eye on the memory usage footprint to ensure smooth workflows, proactive troubleshooting, and resource usage optimization.
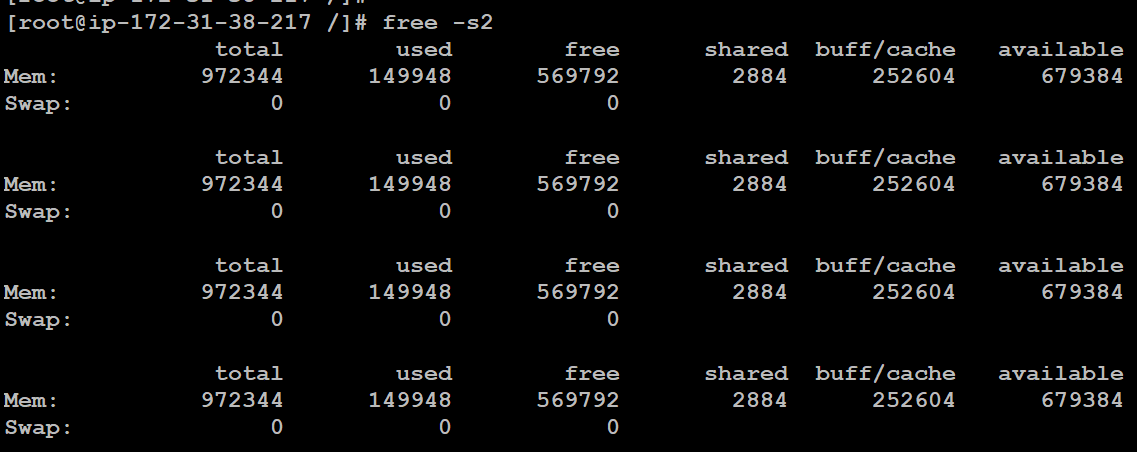
We recommend using the -s option to monitor RAM usage in near real-time. You can specify the delay between each refresh. For instance, consider the following command that refreshes every two seconds:
# free -s2
Example #3: Specify Output Units
Specifying output units in the output of the free command is crucial for understanding the magnitude of memory values and planning for current and future RAM requirements.
You can choose to uniformly display memory values using powers of 1024 or 1000.
Display RAM Values in Powers of 1024
You can use the following flags to display values in powers of 1024.
- -b, –bytes
- -k, –kibi
- -m, –mebi
- -g, –gibi
- –tebi
- –pebi
Consider the following command to display RAM values in mebibytes:
# free -m
Display RAM Values in Powers of 1000
You can use the following flags to display values in powers of 1000.
- –kilo
- –mega
- –giga
- –tera
- –peta
For instance, consider the following command that outputs RAM values in megabytes:
# free --mega
Example #4: Print Multiple Outputs
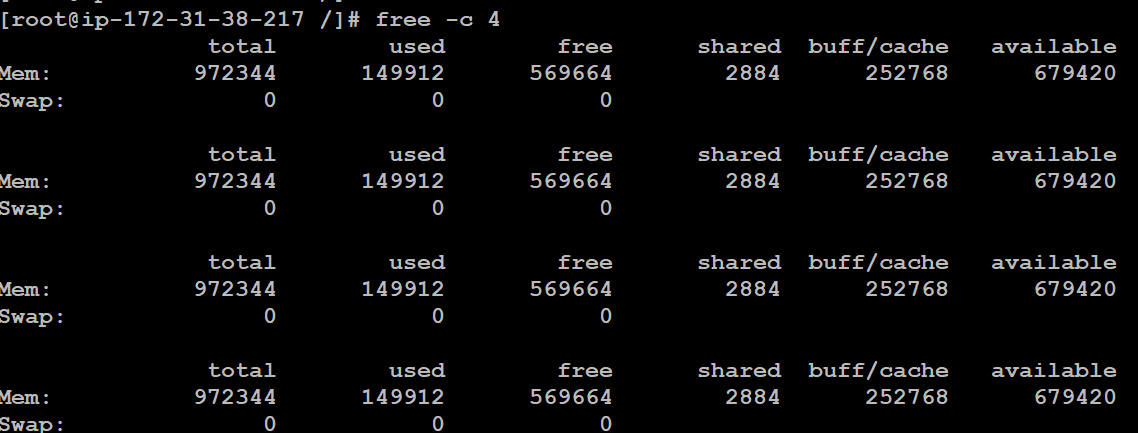
You need multiple RAM values output for dynamic tracking, data logging, and diagnostic purposes. The free command supports the -c option, which automatically quits after a specific number of output refreshes.
For instance, consider the following command that prints four updates of RAM consumption and then quits:
# free -c 4
Example #5: Distinct Buffers and Cache Columns
RAM is usually used to set up system buffers and caches. Since these two data storages have different applications, As such, admins should have a clear idea of the RAM allocated to them for enhanced visibility, performance monitoring, and resource allocation management.
You can view buffers and cache columns separately with the -w option in the following syntax:
# free -w
Example #6: Display Total Memory Column
You can see the total memory column to assess, plan, diagnose, and optimize memory usage in Linux systems systems.
For this, you can use the –total option that prints a Total line summing values from the Mem and Swap lines’ total, used, and free columns. The command in this context will be:
# free -h --total
Conclusion
Monitoring RAM usage on servers or systems is a valuable utility for system administrators to identify potential issues. We presented the free command as a simple solution for this challenge.
RedSwitches is your global dedicated hosting partner, offering bare metal hosting solutions tailored to enhance your business operations. We offer the best dedicated server pricing and deliver instant dedicated servers, usually on the same day the order gets approved. Whether you need a dedicated server, a traffic-friendly 10Gbps dedicated server, or a powerful bare metal server, we are your trusted hosting partner.
FAQs
Q. What is physical memory?
Physical memory, also known as RAM, refers to a computer’s hardware component that temporarily stores data and instructions for the CPU to access quickly.
Q. How does swap memory work?
Swap memory is a space on a hard drive the operating system uses when it runs out of physical memory. It temporarily allows inactive RAM data to be moved to disk to free up space for more important data.
Q. What is swap space?
Swap space refers to the allocated disk space that serves as virtual memory when physical memory (RAM) is full. It helps prevent system crashes due to insufficient memory.
Q. How can I check the memory in bytes, gigabytes, or megabytes?
To check memory in different units, you can use tools like Linux free command or top command, which display memory usage in bytes, kilobytes, megabytes, or gigabytes.
Q. What is a swap partition?
A swap partition is a dedicated section of a hard drive that the operating system uses exclusively for swap memory purposes.
Q. What is cache memory?
Cache memory is a high-speed volatile memory used by the CPU to store frequently accessed data for quick retrieval, reducing the need for slower storage like RAM or hard drives.
Q. What is virtual memory, and how does it relate to swap memory?
Virtual memory is an abstraction technique that allows a computer to compensate for physical memory shortages by temporarily transferring data between RAM and disk storage (such as swap memory).
Q. How can I view CPU and cache usage?
To monitor CPU and cache usage, you can use tools like top command or vmstat that provide real-time information on system performance.

![free [options]](https://www.redswitches.com/wp-content/uploads/2024/04/free-options.png)


