
Every system and user application on your Linux system needs at least one process to do its work. That’s why checking active processes is like finding out what’s happening on your system.
Checking active processes helps ensure everything is running as expected on the system. If your system is sluggish, we recommend checking the active process list to see if a process is consuming more than its share of resources.
This tutorial will describe five easy ways you can check active Linux processes. We’ll start with a detailed look at Linux processes and then go into the details of the several commands Linux offers for checking the details of Linux processes. Admins can use these commands to understand how to handle the complexities of managing system and user processes in a Linux environment.
Table Of Content
What is a Linux Process
In Linux, a process is an instance of a program or application on your system. Processes are fundamental to the Linux environment because they allow multiple tasks to be executed simultaneously. As a result, users and system applications can work side-by-side to accomplish operational activities.
Basic Concepts About Linux Processes
Here are the key concepts related to understanding processes in Linux:
Process ID (PID)
Each process is identified by a unique number called the Process ID (PID). This number, assigned by the operating system, helps track and control the process throughout its lifecycle.
Parent and Child Processes
Processes are allowed to spawn additional processes to accomplish intermediate tasks. As such, processes can have parent-child relationships. When a new child process is created, it typically inherits characteristics from its parent process. The parent process becomes the root (with an internal PID 1) of a tree structure where all child processes are the branches of the tree.
Foreground and Background Processes
Processes can work in the foreground and background.
A foreground process interacts directly with the user and typically runs in the terminal. During execution, the process blocks the terminal, and the user can’t perform any other activity until it is completed.
In contrast, background processes run independently, allowing the user to keep using the terminal for other tasks while they do their job quietly in the background. This way, the system stays responsive, and the user can multitask more efficiently.
Process States
At any time, Linux processes can be in different states, including:
- Running: When processes run, they are actively executing instructions.
- Sleeping: In this state, a process waits for an event. This is a common state when a process is waiting for a disk I/O event.
- Stopped: In this state, the process is paused temporarily, often by a user or system.
- Zombie: A zombie process has finished its job and is waiting for the termination signal from the owner.
Process Priority
Each process has a priority level determining its access to system resources. Higher-priority processes get more CPU time and resources. Users with sufficient permissions can change process priority to speed up task execution.
Daemon Processes
These background processes run without direct user interaction and often perform system tasks. Examples include cron jobs, web servers, and database servers.
Process Communication
Linux processes can communicate with each other through mechanisms like pipes, signals, sockets, and shared memory, facilitating inter-process communication (IPC).
Process Termination
Processes can exit voluntarily once they complete their tasks or terminate involuntarily due to errors or external signals. The exit status of a process provides information about its completion and termination.
How to Check Running Processes in Linux
Linux offers several utilities to monitor and manage processes. These utilities provide various ways to monitor processes, system performance, and resource usage. We’ll now discuss five ways of checking running processes in Linux. But first, let’s see the prerequisites to using these methods.
Prerequisites
Before moving next to start using commands, ensure the following prerequisites are met:
- A system running a mainstream Linux distribution
- A user account with root privileges.
- Access to the command line interface (CLI).
Method #1: Use the ps Command
The ps (process status) command is used to view information about currently running processes.
It provides a static list of processes when the command is running. This means the ps command output is not updated in real-time like other monitoring tools (such as top).
The basic syntax of the ps command is as follows:
# ps [flags/options]
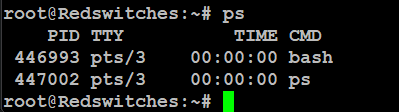
When executed without any flags, the output shows the following information:
- PID: A unique ID for each process.
- TTY: The terminal where the process is active.
- TIME: How much CPU time the process has used.
- CMD: The command that initiated the process.
Common Command Options
We recommend the following flags to customize the command’s output:
- ps -e: Displays all processes running on the system
- ps -f: Shows a full-format listing, which includes additional details like parent process ID (PID) and user ID.
- ps -u [username]: Lists processes running for the specified user.
- ps -aux: Shows running server processes for all users, and CPU and memory usage.
- ps -l: Provides a long format listing, with more detailed information about each process.
- ps -p [pid]: This command displays information about the process with the specified PID. This is a quick way of finding PID before you kill a process.
- ps -ef: Shows an extended full-format listing that shows process hierarchy and relationships.
- ps -o [format]: This command allows you to customize the output and specify which columns to display.
- ps -T: Displays threads and processes, offering detailed insights into CPU usage and process management.
- ps –forest: This command shows processes in a hierarchical tree format, which can help you understand parent-child relationships and manage complex process trees.
Common Command Use Cases
Let’s look at some common use cases:
List All Running Processes With Details
# ps aux
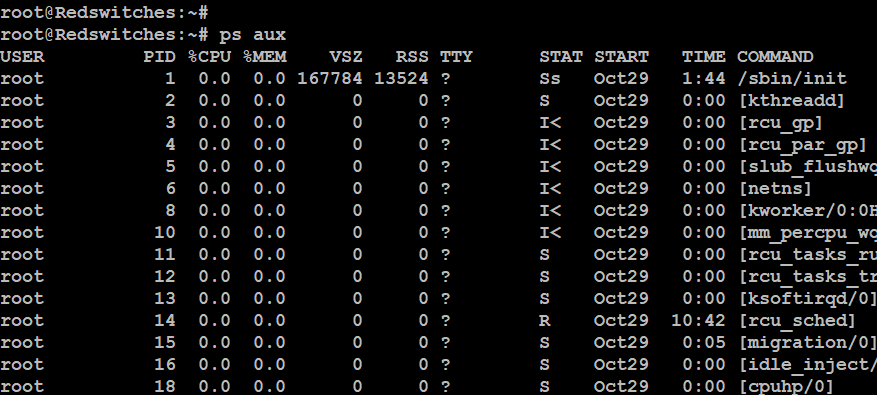
The detailed output has these new sections:
- User: The user account running the process.
- %CPU: The percentage of the CPU time the process has consumed.
- %MEM: The percentage of the memory the process has consumed.
- VSZ: The total amount of virtual memory the process has used, measured in kilobytes (KBs).
- RSS: The amount of actual physical memory (RAM) the process has consumed.
- STAT: The current status of the process.
- START: When the process began.
Show Running Processes in a Tree-like Format
# ps -axjf

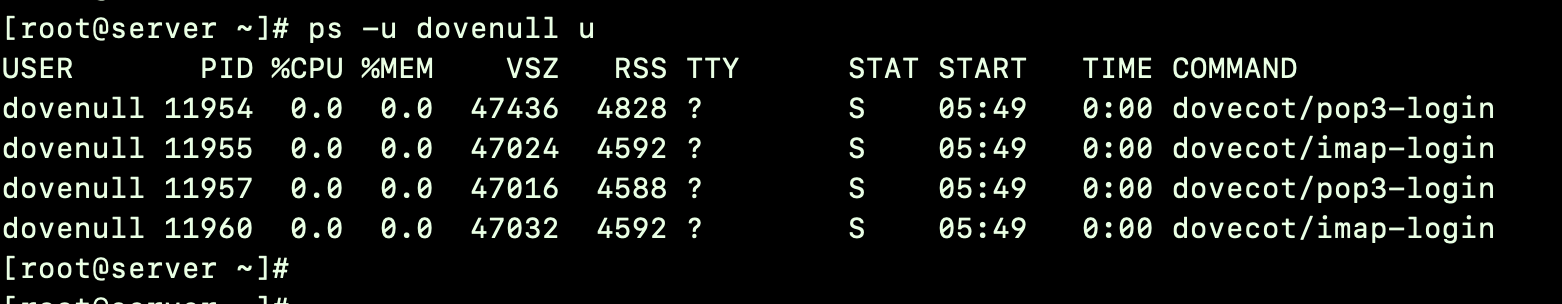
See All Processes For a Specific User
# ps -u [effective user ID or name] u
For instance, # ps -u dovenull u
Method #2: Use the top Command
The top command provides a dynamic, real-time overview of system processes and their resource usage.
The following basic syntax of the command shows real-time process overview and resource usage in the terminal;
# top.
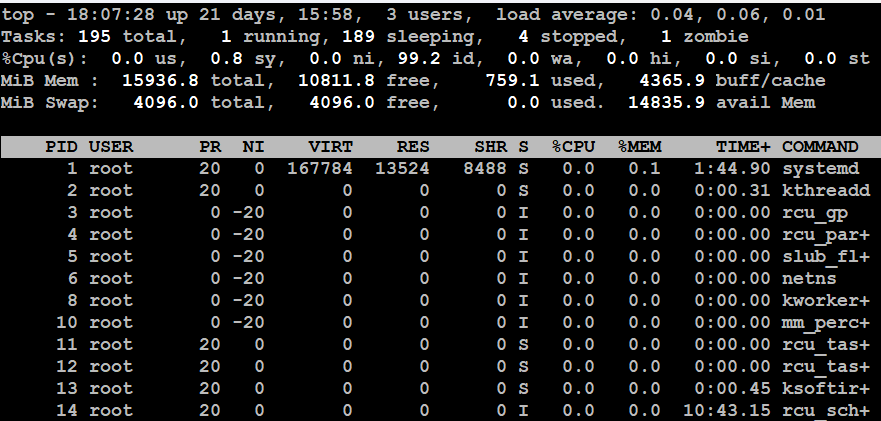
This output is updated every three seconds and shows the following critical information:
- PID: This is a unique number that identifies each process.
- USER: This is the username that initiated the process.
- PR: This shows how vital the process is to the computer’s scheduler.
- NI: This is a value that affects the process’s priority. Lower numbers in this scenario mean higher priority.
- VIRT: This is how much virtual memory the process is using.
- RES: The volume of the physical memory the process is using.
- SHR: This is the amount of memory shared with other processes.
- S: Indicates whether the process is running (R) or sleeping (S).
- %CPU: This shows what percent of the CPU’s power the process uses.
- %MEM: This shows how much of the computer’s memory the process uses.
- TIME+: This shows how long the process has used the CPU.
- COMMAND: This is the command that started the process.
The top command presents a dynamic view of running processes, sorted by default by CPU usage. It displays process details such as process ID (PID), user, CPU usage, memory usage, etc.
You can use keyboard shortcuts like q to quit/exit, k to kill a selected process, u to filter by user, and Space to refresh the display.
You can sort the default listing by pressing P to sort by CPU usage, M to list by memory usage, and T to sort by process running time. Similarly, you can use z to color-highlight running processes, and c to toggle between showing and hiding command arguments.
Method #3: Use the htop Command
The htop command is an interactive and user-friendly command that lists running processes. Admins use it to monitor running processes because of the visually informative presentation of the output.
Install htop
Because this command is usually not included in many Linux distributions, you can add it to your Linux system by installing it with the following command:
# sudo apt install htop
Using the htop Utility
Open the terminal, type htop and press Enter.
You’ll see the output, similar to the following screenshot:

htop provides a real-time view of running processes. It displays a list of processes with essential details such as process ID (PID), user, CPU usage, and memory usage.
As mentioned earlier, htop offers an interactive interface that uses colors to help you easily see resource consumption and process status.
Process Manipulation
You can use the arrow keys to navigate through the process list and the function keys at the bottom for various actions.
Additionally, you can perform actions on processes directly from the utility’s interface. For instance, you can send signals to processes (e.g., terminate or pause) by selecting them and pressing the appropriate key (e.g., k to kill a process).
You can change the default process by sorting by CPU usage (use the P key), memory usage (use the M key), and the F4 key to search processes by keywords.
Finally, press the q key to exit htop and return to the terminal.
htop Navigation and Hot Keys
The htop utility offers several options to interact with the output. Here’s a short list of the common options:
- Directional (Arrow) keys: Move up, down, left, and right through the list of processes.
- F1: Opens the help screen.
- F2: Takes you to the settings for the htop command, where you can set columns to display and other settings.
- F3: Search for a process by name.
- F4: Lists only specific processes based on the name.
- F5: Switch views between a list and a tree.
- F6: Arrange processes based on details like CPU usage, memory, etc.
- F7: Makes the selected process run faster (by giving it a higher priority).
- F8: Makes the selected process run slower (giving it a lower priority).
- F9: Stop the process you have selected.
- F10: Closes the htop command window.
Method #4: Use the atop Command
The atop command monitors and displays real-time system and process activities in detail. It provides a comprehensive view of system performance, including CPU, memory, disk, and network usage, and shows insights into individual processes’ resource consumption.
Install atop
Since atop is not usually included in the core Linux commands, it might not be available on your Linux system. However, you can easily install it on your system with the package manager. For instance, on Debian-based systems, use the following command:
# sudo apt-get install atop
On RHEL-based systems, you can use:
# sudo yum install atop
Using the atop Utility
Launch the utility by entering the following command in the terminal:
# sudo atop
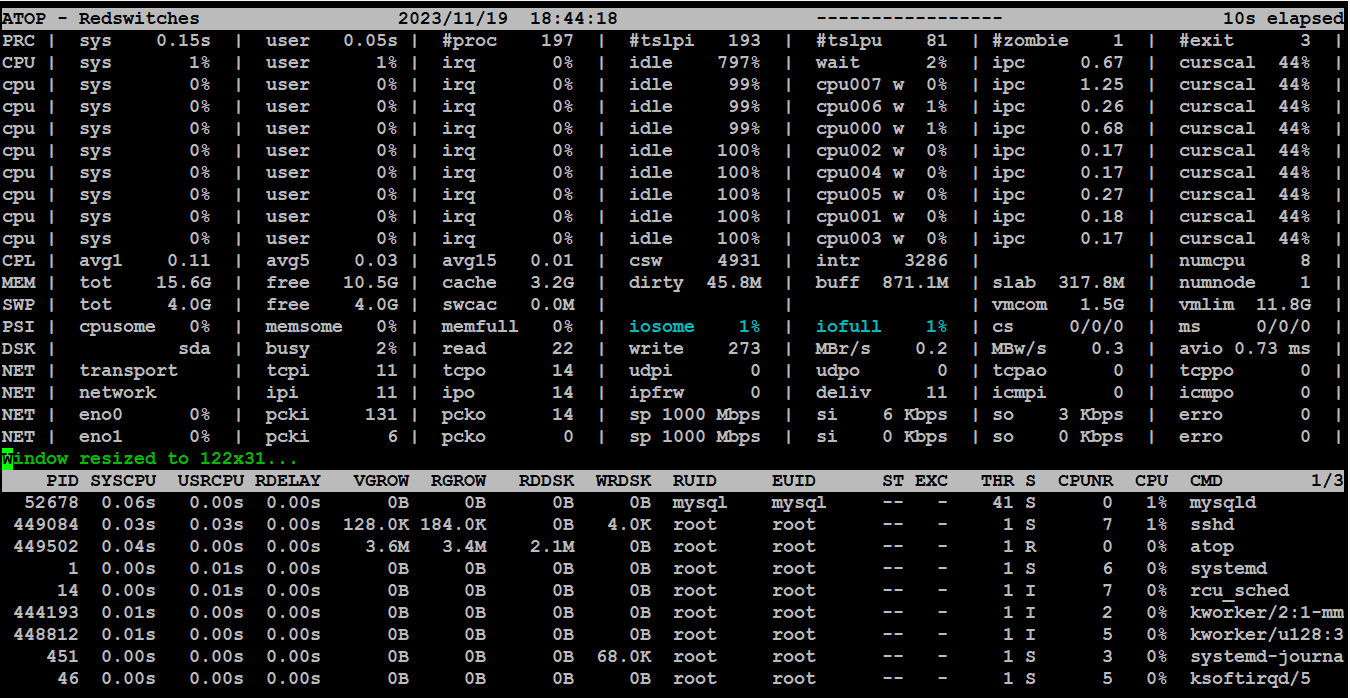
The command’s output summarizes system resource consumption and the details about system processes.
The lower portion of the utility’s display shows the processes that are currently running. This section shows the following information:
- PID: A unique number that identifies each process.
- SYSCPU: How much CPU time the process uses for system tasks?
- USRCPU: How much CPU does the process use when doing user-related tasks.
- VGROW: How much virtual memory has been added since the last check
- RGROW: How much resident (page) memory has the process added since the last check?
- RUID: The ID of the user who started the process.
- ST: The current state of the process.
- EXC: The exit code of the process.
- THR: How many threads (sub-processes) is the process using?
- S: The current state of the process’s main thread.
- CPUNR: How many CPUs is the process using?
- CPU: The percentage of the CPU being used by the process.
- CMD: The command that was used to start the process.
Common atop Utility Flags
You can try the following flags with the atop command to alter the information it displays:
- -a: Only shows processes that are currently active.
- -c: Displays what command each process is running.
- -d: Shows information about disk usage.
- -l: Displays average values per second instead of total counts.
- -m: Provides details on memory usage.
- -n: Shows data about network usage.
- -s: Displays details on how processes are scheduled.
- -v: Gives a more verbose (detailed) output.
- -y: Shows each separate thread in the process.
By default, atop will display a live view of system performance. You can use various keyboard shortcuts to navigate and customize the display. Press h for help within the atop display to see the available options.
Let’s see some more keyboard shortcuts and commands:
- Switch to process view: Press P to focus on processes. This will display a list of running processes. In this view, you’ll see a list of processes and details like process ID (PID), user, CPU and memory usage, and disk I/O. You can sort the list by column (e.g., CPU usage) by pressing the corresponding keyboard shortcuts.
- Arrow Keys for Navigation: You can navigate through the process list using the arrow keys. To get more details about a specific process, select it and press d to display detailed information about it. Press q to exit the detailed view.
- Filter the Process List: You can filter the process list based on various criteria. Press L to filter processes by user, t to filter by process tree, and f to filter by process name.
- Sorting Processes: You can use the following keys to sort the result based on different factors:
- a: Order by the resources used the most.
- c: Order by how much CPU is being used.
- d: Order by activity on the disk.
- m: Order by how much memory is being used.
- n: Order by activity on the network.
- Exiting atop: To exit atop, press q.
Method #5: Use the pgrep Command
The pgrep command is used to search for and retrieve the process IDs (PIDs) that match specific criteria, such as process name.
The Command’s Basic Syntax
The basic syntax of the command is:
# pgrep [flags] pattern
Here:
flags: You can use various flags to modify the command’s behavior.
pattern: The pattern or criteria you want to match in the process names.
Let’s see several use cases of this command.
Search for a Process by Name
To find the PID of a process by name, simply use pgrep followed by the process name:
# pgrep sshd
This command would return the PID(s) of all running processes with the name sshd.
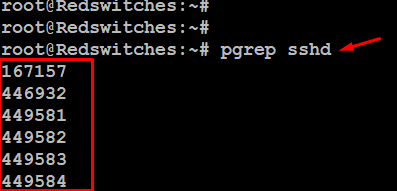
You can obtain further process information using this PID with the ps command. In this instance, we can obtain further information on the SSHD process by using the PID 167157:
# ps -e | grep 167157

Search for a Process Owned by a Specific User
To search for processes owned by a particular user, use the -u flag and the user name:
# pgrep -u john
This command would return the PID(s) of all processes owned by the user name john.
Search for a Process with a Full Command Match
You can also search for a process with a full command match, including arguments:
# pgrep -f "python script.py"
This would return the PID(s) of all processes where the command statement contains python script.py.
Search for a Process With Regular Expressions
You can use regular expressions with pgrep to perform more complex searches. For instance:
# pgrep -f "app[0-9]*\.sh"
This command would find processes with command statement matching patterns like app1.sh, app2.sh, and so on.
Note: By default, pgrep returns the PID of the first matching process it finds. To retrieve all matching PIDs, use the -l option, which lists PIDs and process names together.
Conclusion
In this tutorial, we explored how to check active processes in Linux using simple terminal commands like ps, top, and htop to manage running processes quickly.
We also learned their basic syntax and handy tips for quickly grasping system insights. With this step-by-step guidance and screenshots, you can master the art of efficient process management.
If you’re looking for a robust server for your Linux projects, RedSwitches offers the best dedicated server pricing and delivers instant dedicated servers, usually on the same day the order gets approved. Whether you need a dedicated server, a traffic-friendly 10Gbps dedicated server, or a powerful bare metal server, we are your trusted hosting partner.
FAQs
Q. What are Linux processes?
Linux processes are instances of programs in the Linux operating system. Each process has its unique process ID (PID) and attributes.
Q. What is an introduction to Linux processes?
An introduction to Linux processes provides a basic understanding of how processes work in the Linux environment, including their creation, management, and interactions with the system.
Q. How can I list all processes in Linux?
You can use the command ps aux to list all processes in Linux. This command displays a detailed list of all currently running processes on your system.
Q. How can I list processes in Linux in a hierarchical order?
In Linux, you can use the pstree command to list processes hierarchically. This command visually represents the process status in a tree structure, showing their relationships and hierarchy.
Q. How do I kill a process in Linux?
You can use the kill command followed by the PID of the process you want to terminate. For example, “kill 1234” will send a termination signal to the process with PID 1234.