All seasoned system administrators understand the value of a reliable and efficient log management tool. The importance of these solutions becomes critical when the admins carry out system health checks and troubleshoot issues.
Linux systems contain journald, a simple utility that maintains detailed logs of system events. You can read the logs using journalctl, a companion utility that removes the hassle of working with system logs maintained by journald.
In this article, we will check out the features and benefits of journalctl and explore its potential for log analysis, troubleshooting, performance monitoring, and security auditing.
So, whether you are a system administrator, developer, or security analyst, understanding the journalctl service’s capabilities and harnessing them will undoubtedly elevate your Linux log management expertise.
Let’s start with a short introduction to journalctl and then see how to use this utility to check systemd log files.
Table Of Contents
- Introducing Journalctl
- Set Up Journalctl Service for Local or Standard Time
- View Logs Through Journalctl
- Filtering Log Entries by Time
- Sorting Log Entries by Message Interest
- Optimize the Log Entry Display With Journalctl
- Process Monitoring with Journalctl
- Log Maintenance Through Journalctl
- How to Restart the Journal Service
- Conclusion
- FAQ
Introducing Journalctl
Journalctl, a command-line utility, is a powerful and versatile solution for managing logs in modern Linux distributions.
By leveraging the systemd journal and systemd log files, journalctl provides a centralized and comprehensive view of system activity. System administrators use this interface to extract essential information for practical analysis and diagnostics.
Logs in a Linux system were traditionally dispersed across various files and locations, making gathering and analyzing information cumbersome. However, with the advent of systemd (an initialization system used by many Linux distributions), a unified and structured logging system called the systemd journal was introduced. The initial versions of the utility lacked an interface that could simplify information extraction from systemd log files.
Journalctl is the primary interface to access and interact with this centralized log repository.
The systemd journal captures log entries from many sources, including the Linux kernel, system services, and user applications. This aggregation of systemd logs into a single location simplifies log management, enhances system visibility, and offers a range of powerful capabilities to handle log analysis tasks efficiently.
Journalctl empowers administrators by providing real-time log monitoring, advanced filtering querying options, and seamless integration with other systemd components. Its ability to handle logs in a binary format ensures efficient storage and retrieval, while its flexible output formatting options cater to diverse user needs.
In fact, you can use popular utilities such as grep and AWK to extract relevant information and give the reports the desired formatting.
Set Up Journalctl Service for Local or Standard Time
One of the advantages of using a binary journal for generating systemd log files is the flexibility to view log records in either Coordinated Universal Time (UTC) or local time, depending on your preference(or requirements). By default, the systemd displays log records in local time to align with the system’s time zone configuration.
However, you can easily switch between UTC and local time when viewing journalctl log entries.
To change the time format in which log records are displayed, you can utilize the –utc or –local options with the journalctl command.
Displaying Logs in UTC Time
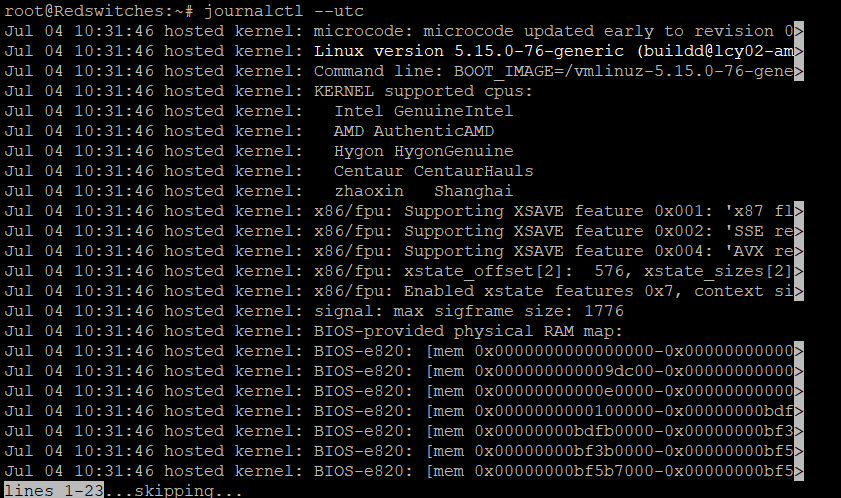
To view log records in UTC, use the –utc option when running the journalctl command. Here’s the syntax:
$ journalctl --utc
This command will display log entries with timestamps converted to UTC.
Displaying Logs in Local Time
By default, the journalctl service displays log records in the system’s local time zone. However, if you want to specify that log entries should be displayed in local time, you can use the –local option:
$ journalctl --local
This command ensures that log entries are shown in the local time zone configured on the system.
It’s important to note that changing the time format for the systemd log file display using the –utc or –local options doesn’t modify the actual time stored in the binary journal. It only affects how the timestamps are presented when the user views the logs.
By providing the flexibility to switch between UTC and local time, systemd’s binary journal and journalctl service cater to diverse needs and user preferences regarding log analysis and troubleshooting in different time zones or global environments.
View Logs Through Journalctl

Viewing logs is an essential aspect of system administration and troubleshooting.
journalctl is a powerful tool for accessing and viewing logs stored in the systemd journal.
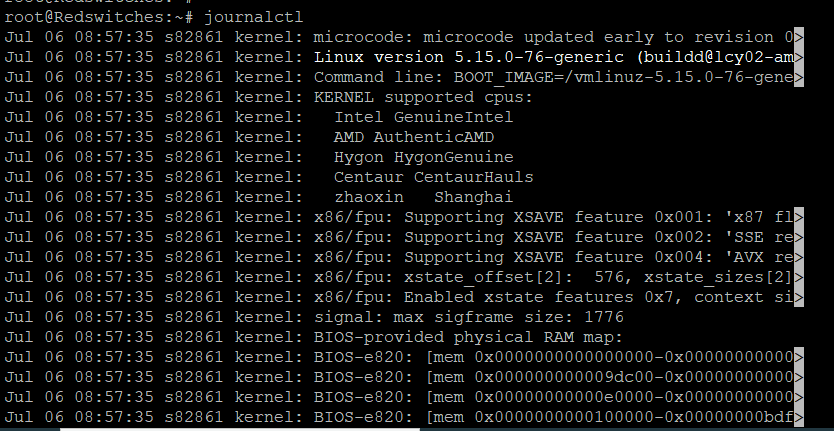
By default, running the “journalctl” command without any options displays the system logs. To test this, enter the following command in the terminal:
$ journalctl
The system logs are displayed in reverse chronological order, starting with the most recent entries.
Scrolling Through the Logs
The output of the journalctl command might fill the terminal window depending on the number of log entries. To scroll through the logs, you can use the following techniques:
- Use the arrow keys to move up and down the log entries.
- Press the Spacebar to scroll down one page at a time.
- Press the “b” key to scroll back one page at a time.
- Press “q” to exit the log viewing.
Filtering Logs by Time
System admins generally don’t scroll through the log files. They often need to see log entries for a specific time window to understand what happened during an incident.
journalctl allows filtering log entries based on a specific time range. For example, to view logs from the last hour, use the “–since” option:
$journalctl --since "1 hour ago"
Similarly, you can use the “–until” option to specify an end time for log filtering. We’ll discuss log entry filtering based on time later on in this article.
Filtering Logs by Unit
Another real-world log analysis use case is isolating entries for specific services.
This is an essential application because incident investigation generally involves working through the active services and eliminating services individually to discover the service that failed or caused the incident.
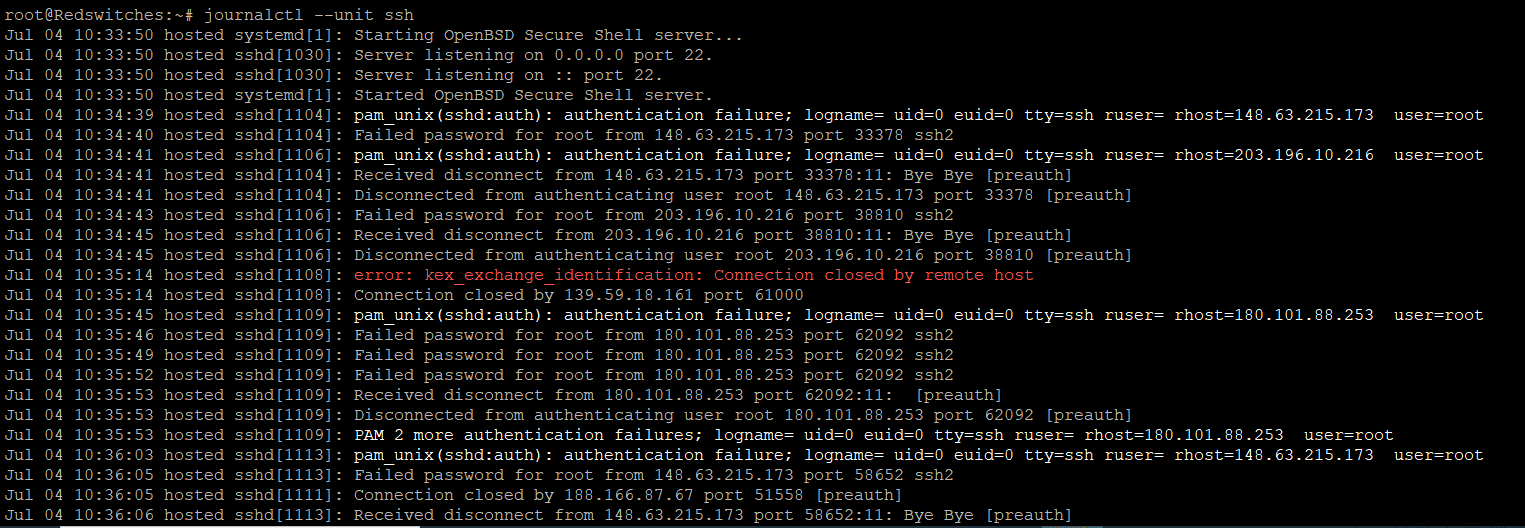
You can narrow the culprit by filtering log entries for specific units or services. For example, to view logs related to the SSH service, use the “–unit” option:
$journalctl --unit ssh
This will display log entries associated with the SSH service.
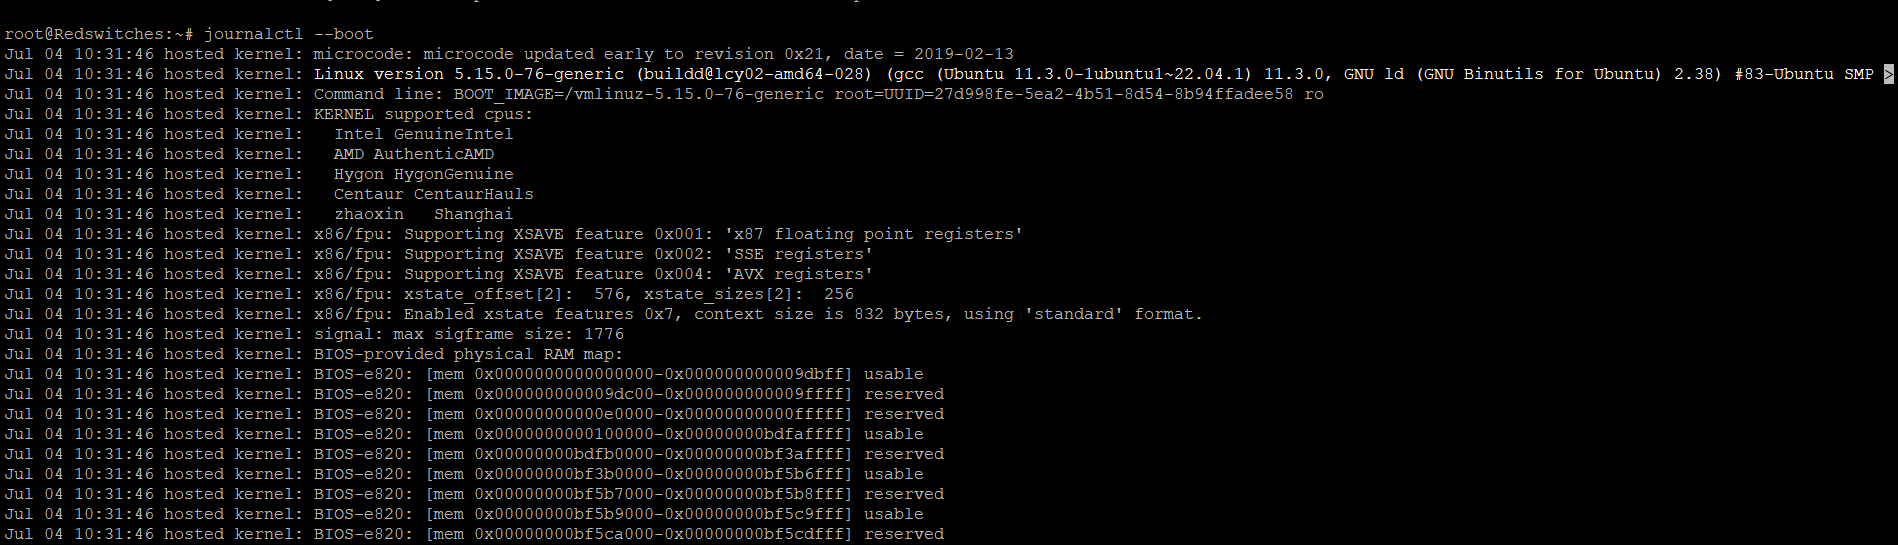
View the Boot Logs
Server boot-up is a significant event in server operations. The effects can ripple throughout the active session if anything goes wrong during the boot process.
To view the logs from the current boot session, use the “–boot” option:
$ journalctl --boot
This command displays log entries from the current boot session only.
These are some basic commands and options for viewing systemd log files via the journalctl service.
However, journalctl offers more advanced features, including filtering by priority, searching for specific keywords, exporting logs, and more. We suggest going through the journalctl documentation to discover the extensive capabilities of this powerful log-viewing tool.
Filtering Log Entries by Time
Filtering log entries based on specific time criteria can be helpful when searching for entries within a specific timeframe or investigating events that occurred during a particular period.
The journalctl command in Linux provides various options for filtering logs by time.
Here’s a guide on how to perform time-based filtering with journalctl:
Filtering Logs by a Specific Time Range
To filter logs based on a specific time range, use the “–since” and “–until” options with journalctl. Here’s an example:
$journalctl --since "2023-06-25 00:00:00" --until "2023-06-26 23:59:59"
Filtering Logs from a Relative Time Point
Instead of specifying exact dates and times, you can use relative time expressions to filter log entries. Here are some common examples and the related journalctl commands:
Filtering logs from a specific number of minutes, hours, or days ago:
$journalctl --since "10 minutes ago"
$ journalctl --since "2 hours ago"
$ journalctl --since "1 day ago"
Filtering logs until a specific time relative to the current time:
$journalctl --until "30 minutes ago"
$journalctl --until "1 hour ago"
$journalctl --until "3 days ago"
These commands will display log entries from the specified time relative to the current time.
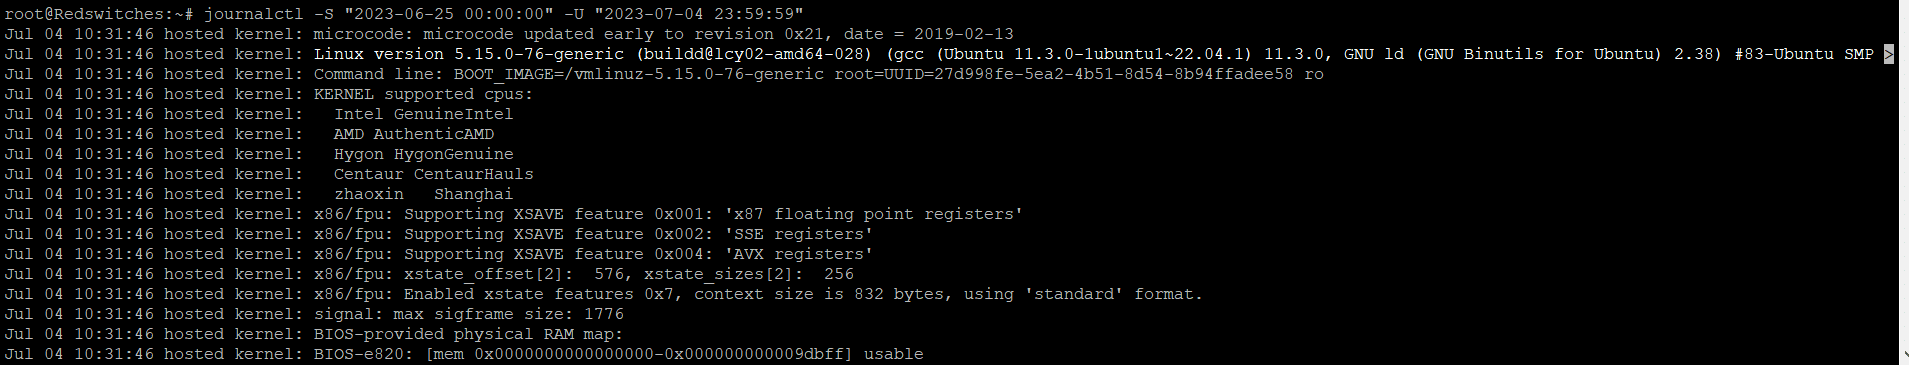
Filtering Logs by Time Range using Short Options
For convenience, journalctl provides short options to represent time ranges. The “-S” option is used to specify the start time, and the “-U” option is used to specify the end time. Here’s an example:
$journalctl -S "2023-06-25 00:00:00" -U "2023-06-26 23:59:59"
This command displays the log entries between the specified time range.
Utilizing these time-based filtering options allows you to effectively narrow down log entries and focus on specific time intervals that correspond to specific incidents. This can be beneficial for troubleshooting, auditing, or analyzing events within a specific timeframe.
Sorting Log Entries by Message Interest
It can be tedious and stressful to manually sift through long log files for particular messages or event occurrences.
You can get the most relevant information by using the various options for message-interest-based log filtering journalctl offers to the users.
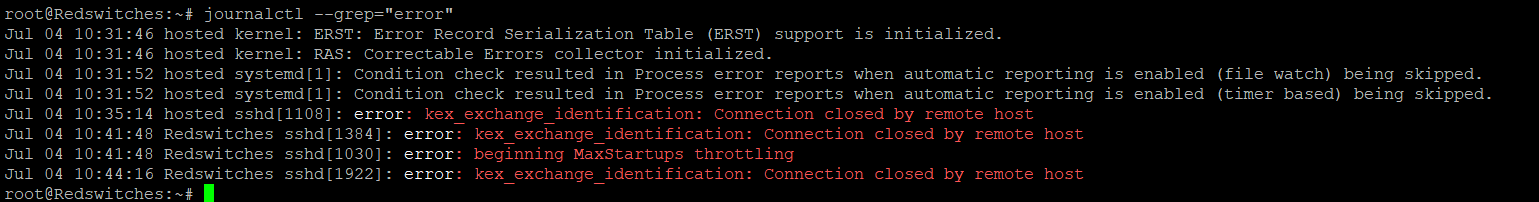
Filtering Log Entries by a Specific Keyword
To filter logs based on a specific keyword or message, use the –grep option with journalctl to filter out target entries. For example, to filter log entries for occurrences of the word “error,” use the following command:
$journalctl --grep="error"
This command will display log entries containing the keyword “error.” You can replace “error” with any other keyword to get the desired entries.
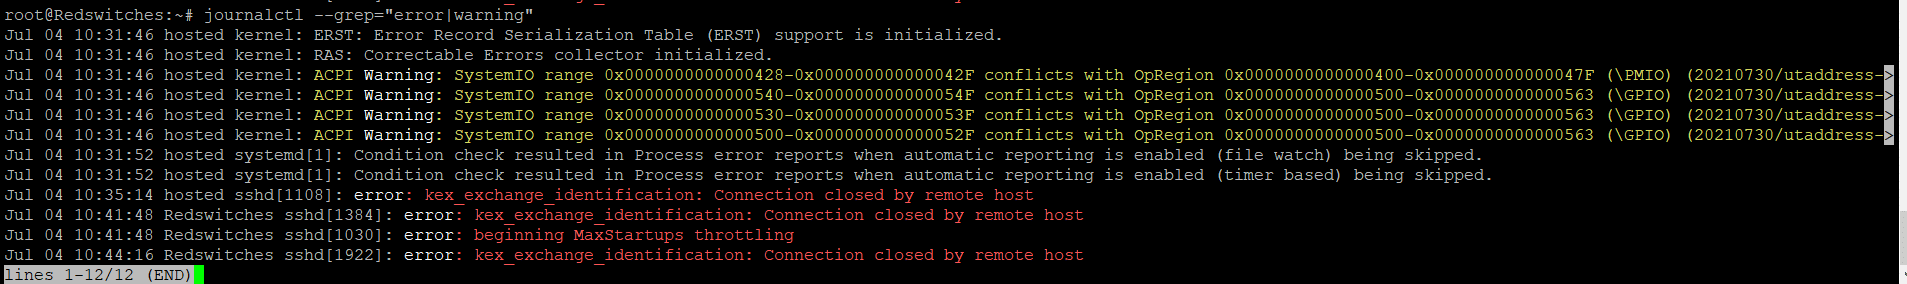
Filtering Log Entries by Multiple Keywords
You can filter logs by multiple keywords using regular expressions and the “–grep” option. For example, to filter logs for entries containing either “error” or “warning,” you can use the following command:
$journalctl --grep="error|warning"
This command will display log entries that match “error” or “warning.”
Combining Filters for Advanced Log Entry Analysis
You can combine multiple filters to further narrow log entries during incident investigation.
For example, to filter logs for entries containing “error” and related to the “sshd” service, use the following command:
$ journalctl --grep="error" --field _SYSTEMD_UNIT=sshd.service
This command will display log entries matching the error keyword and the specified service.
Using these filtering techniques, you can efficiently sift through log files and focus on the specific messages or events you are interested in. Using the right filters for the journalctl service can significantly simplify troubleshooting and analysis, allowing you to quickly identify and address relevant issues buried deep within the log data.
Optimize the Log Entry Display With Journalctl
The journalctl command in Linux provides various options for customizing the display of log entries. System admins can use these commands and options to speed up log analysis and tailor the output to meet their specific needs.
We’ll now explore several options and scenarios that sysadmins can utilize to get the correct information in the desired format:
Limit the Number of Entries
By default, journalctl displays the 10 most recent log entries.
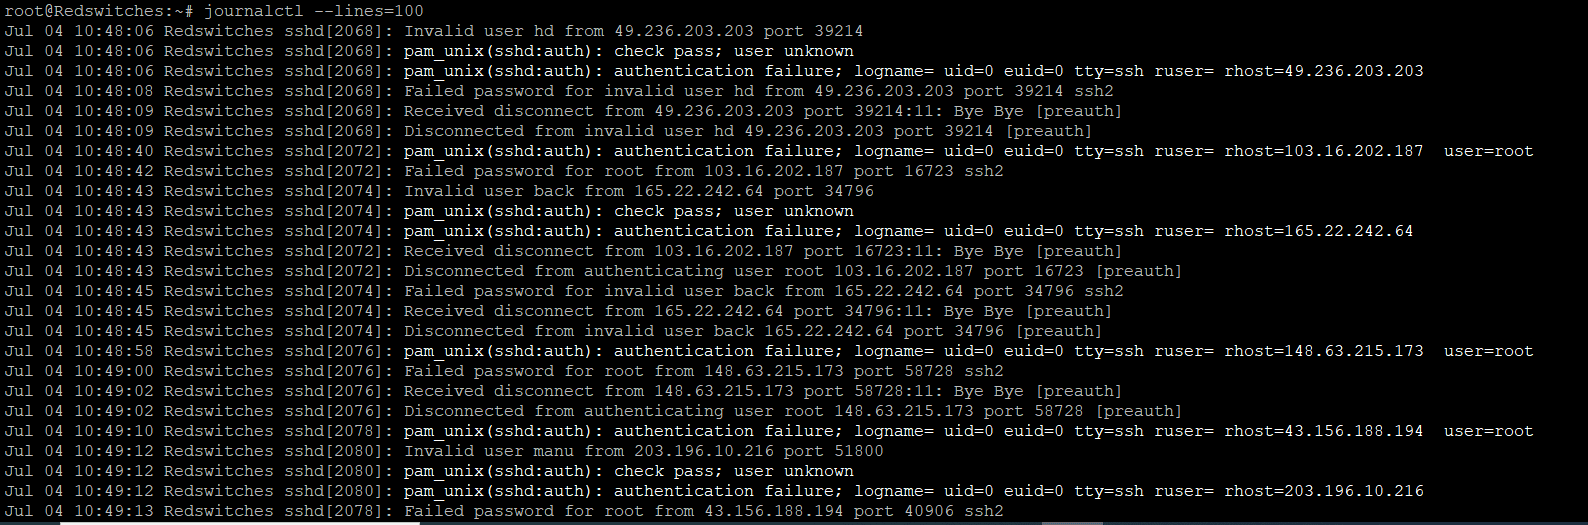
However, you can use the “–lines” option to specify the maximum number of log entries to display. For example, using journalctl, the last 100 lines in the log entries can be displayed with the following command:
$ journalctl --lines=100
Displaying the Latest Entries
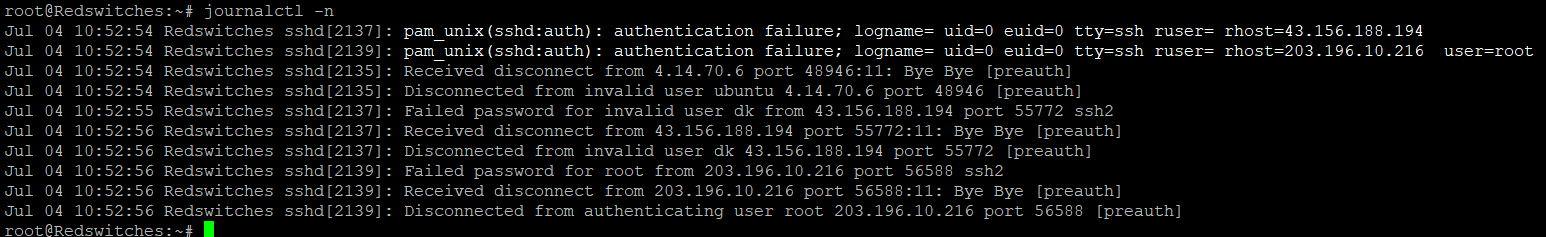
You can view only the most recent log entries using the “-n” or “-newest” option. This lets you focus on the latest events without scrolling through the entire log.
For example, the following command displays the most recent entries in the log:
$journalctl -n
Display Log Entries in Reverse Order
By default, journalctl displays log entries chronologically, starting with the oldest entry. That is not always the way you need to view the log entries.
So, if you prefer to see the latest entries first, use the “-r” or “–reverse” option.
$journalctl -r
Choose a Format for the Log Entries Output
journalctl allows you to choose the output format to enhance the readability or usability of the log entries. The “–output” or “-o” option allows you to specify the desired output format. Common formats include “short,” “short-iso,” “verbose,” “json,” and “export.” These options allow you to export log entries for further analysis through third-party tools.
$journalctl --output=json
Filter Log Entries by Priority
You can filter log entries based on their priority levels using the “–priority” option. Log entry priority levels range from 0 (emergency) to 7 (debug). You can use the priority name or its corresponding numeric value for simplicity. The priority levels, from highest to lowest, are:
- 0: emerg
- 1: alert
- 2: crit
- 3: err
- 4: warning
- 5: notice
- 6: info
- 7: debug
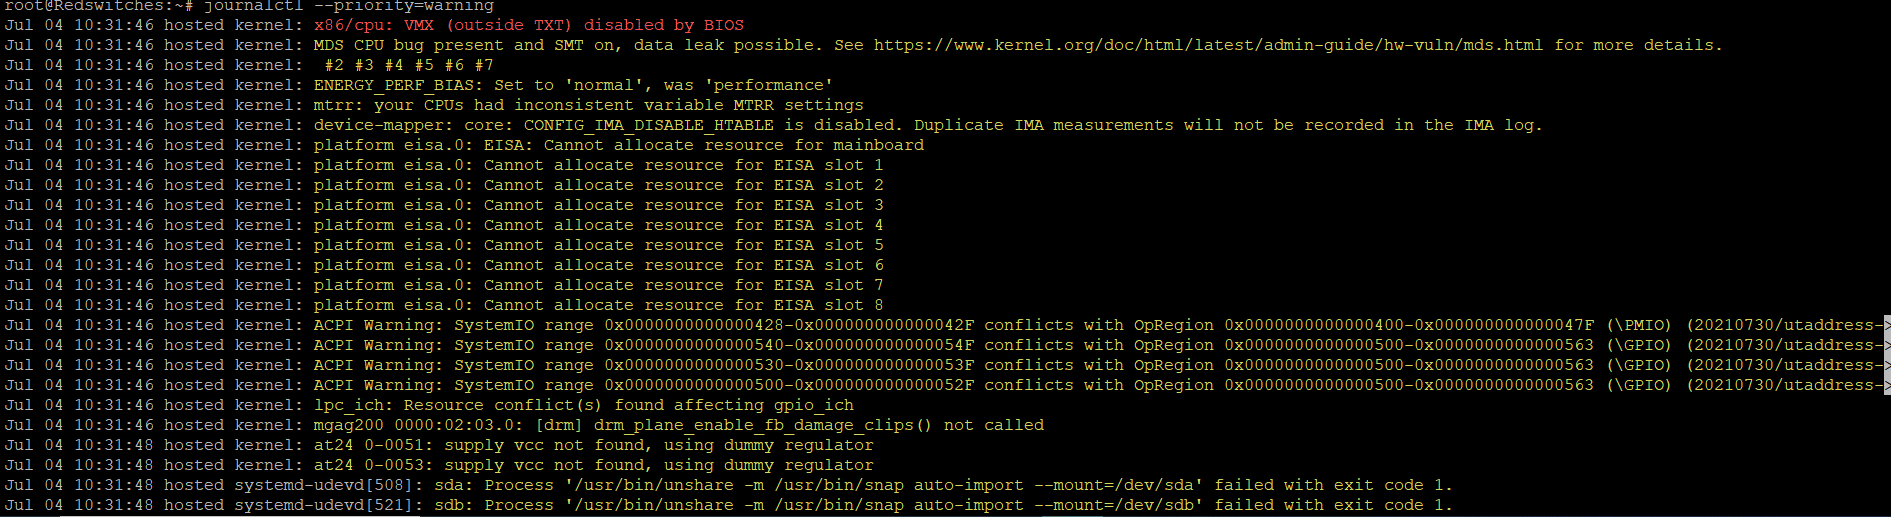
For example, to display the log entries with a priority of “warning” or higher, use the following command:
$journalctl --priority=warning
Process Monitoring with Journalctl
Before going into the details of how you can use journalctl for process monitoring, you should know that it is not designed for directly monitoring running processes.
However, journalctl can be used for this purpose because it can access (and help analyze) system logs produced by various services and processes.
However, by looking at the log entries for particular processes, you can still use journalctl to infer some information about the performance and resource consumption by the processes.
Let’s discuss some ways you can use journalctl for active process monitoring.
You can find log entries associated with specific processes by analyzing the system logs. These entries contain information about process startup, termination, errors, or other relevant events.
The “-grep” option filters log entries based on the process identifier (PID).
$ journalctl --grep="PID="
Replace “” with the actual PID of the process you want to monitor.
Analyze Process Behavior
Examine log entries for the process of interest to gather insights into its behavior. Specifically, look for error messages, warnings, or anomalies indicating issues or abnormal events during the process lifetime.
journalctl _SYSTEMD_UNIT=.service --since "2023-07-01" --until "2023-07-04" -o json-pretty
Here’s a breakdown of the command:
_SYSTEMD_UNIT=.service: Replace with the actual name of the systemd unit associated with the process you want to analyze. For example, if you want to analyze the behavior of the Apache web server process, you would replace with apache2.service. This option filters the logs specifically for the given unit.
–since “2023-07-01”: This option specifies the start time of the log analysis period. Replace the date and time with your desired start time.
–until “2023-07-04”: This option specifies the end time of the log analysis period. Replace the date and time with your desired end time.
-o json-pretty: This option formats the output in a human-readable JSON format for easier analysis. You can omit this option if you prefer the default text-based output.
Adjust these options and filters according to your specific requirements to analyze the process behavior effectively.
Monitor Service Logs
systemd manages most of the processes on a Linux system and creates logs for these processes. You can use journalctl to monitor the logs of specific systemd services.
$ journalctl -u
Remember to replace “” with the name of the systemd service you want to monitor. This command will display the log entries associated with that service.
It’s important to note that while journalctl can indirectly provide some information about active processes through log entries, it is not the most efficient or comprehensive tool for real-time process monitoring.
For more detailed and real-time process monitoring, it is recommended to use dedicated process monitoring tools like “htop,” which are purpose-built for active process monitoring.
Log Maintenance Through Journalctl
Regular maintenance of the journal is essential to ensure optimal performance, proper disk space usage, and organized logs. You can use journalctl for journal maintenance tasks.
Here are some important aspects of journal maintenance:
Managing Journal Disk Space
The systemd journal keeps logs on the disc. Over time, the log files consume significant space. The default sustemd setting is a maximum journal size of 10% of the total disc space.
To counter this, we recommend setting journal size restrictions to control how much disc space is used. The “SystemMaxUse” parameter in the journal configuration file, located at “/etc/systemd/journald.conf,” can change this cap. Use this change to set a suitable size restriction to free up disc space for other system requirements.
Clear Journal Logs
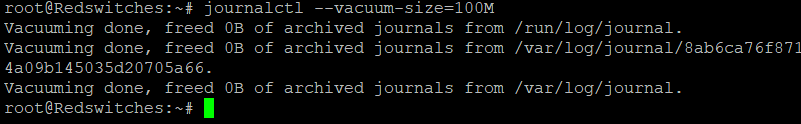
You can use the –vacuum option to remove old or unnecessary logs from the journal. This option lets you specify the desired disk space to free up by removing old logs.
$ journalctl --vacuum-size=100M
This command clears logs until the specified amount of disk space (100 megabytes) is freed up.
Time-Based Log Expiration
You can implement time-based log expiration using systemd.
With this setting in place, you can have logs around for a given time. Once this interval expires, the logs are automatically removed.
For this, you must set expiration parameters in the journal configuration file. The maximum age of individual log files and the overall retention time are controlled by the parameters “MaxFileSec” and “MaxRetentionSec.”
To automatically prevent log expiration, modify these parameters to your needs in the /etc/systemd/journald.conf configuration file.
Journal Compression
The systemd journal supports log compression to save disk space.
By default, journal logs are compressed using the “xz” algorithm. However, changing the “Compress” parameter in the journal configuration file /etc/systemd/journald.conf can modify the compression settings. Set it to “yes” to enable compression or “no” to turn it off.
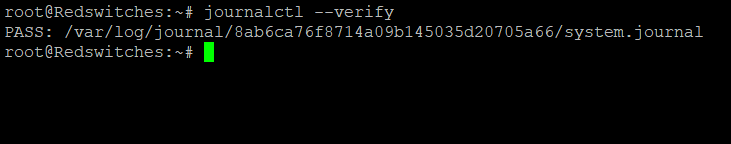
Journal Integrity Check
It is critical to check the journal’s integrity periodically to ensure the logs remain intact and reliable. We recommend using the –verify option to verify the journal’s integrity.
Running this command will consistently check the journal files and report any errors or inconsistencies.
$ journalctl --verify
How to Restart the Journal Service
Sometimes, you may need to restart the journal service to apply configuration changes or resolve issues.
To restart the journal service, use the appropriate command for your distribution. For example, on systems using systemd, you can use the following command:
$systemctl restart systemd-journald
By performing these journal maintenance tasks, you can keep your logs organized, manage disk space efficiently, ensure log integrity, and maintain optimal performance. Monitoring and managing the journal is crucial for effective system administration, troubleshooting, and log data analysis.
Conclusion
Journalctl is a powerful command-line tool in Linux that provides access to system logs generated by various services and processes. It offers extensive capabilities for viewing, filtering, and analyzing log data, making it an invaluable resource for system administrators and users.
While journalctl is not primarily designed for active process monitoring, we highlighted alternative methods and tools specifically tailored for that purpose. We also touched upon the importance of journal maintenance, including managing disk space, clearing logs, configuring log expiration, performing integrity checks, and restarting the journal service.
By mastering journalctl and its capabilities, users can efficiently troubleshoot issues, monitor system performance, and gather valuable insights from log data. Its ability to filter and manipulate log records provides flexibility and convenience, enhancing the process of analyzing and understanding system events.
If you are interested in using journalctl for log analysis, you need a stable foundation for your Linux-powered projects. At RedSwitches, we deliver fully customizable bare-metal servers that support resource-intensive projects such as eCommerce stores and SaaS applications.
Contact our support engineers for free consultations about improving your server infrastructure with bare metal and dedicated servers.
FAQ
Q-1) What is journalctl?
journalctl is a command-line utility in Linux that provides access to the systemd journal, which stores and manages system logs generated by various services and processes.
Q-2) Where are the journalctl logs stored?
The journalctl logs are stored in binary format on disk. They are in the /var/log/journal directory by default.
Q-3) How can I view the system logs using journalctl?
You can view system logs by running the journalctl command without any options. This will display the most recent log entries.
Q-4) Can I filter the logs by time range using journalctl?
You can filter logs by specifying a time range using options such as –since and –until with specific timestamps or time durations.
Q-5) How can I view logs from a specific service using journalctl?
You can use the -u or –unit option, followed by the service name to view logs related to that service. For example, journalctl -u nginx will display logs from the NGINX service.